Please find our most recent market review below. We hope these perspectives are valuable to you.
– The AdvicePeriod Team
Stocks Pause on Fed Pivot
Higher-than-expected inflation readings may put the Fed’s rate-cutting plans on pause.
Key Observations
- The S&P 500 lost 4.1% in April but is still up 6.0% in 2024.
- Small-cap stocks dropped 7.0% and mid-cap stocks fell 5.4% for the month.
- Bonds declined 2.5% for the month.
- International developed markets lost 2.6%, and emerging markets were up 0.5%.
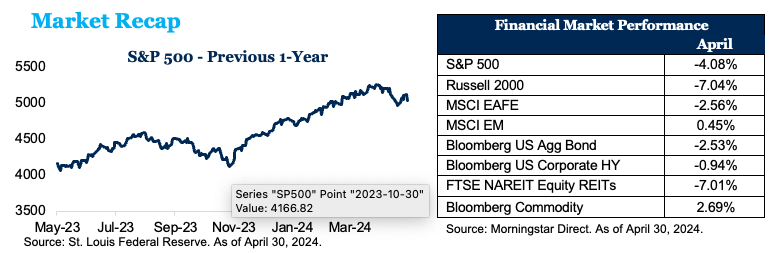
The U.S. stock market took a pause in April, posting a decline of 4.1%. The S&P 500 is still up 6.0% in 2024 and up nearly 23% over the previous one-year period. Small-cap stocks fell 7.0%, while mid-caps declined 5.4%. Non-U.S. developed equities lost 2.5%, while emerging market stocks gained 0.5%, driven by strong performance from China, which was up 6.6% for the month, bouncing back from a sluggish start to the year. The Bloomberg U.S. Aggregate Bond Index was down 2.5% for the month, while the 10-year Treasury yield rose from 4.33% at the start of the month to 4.59% at month-end. Yields on the 2-year Treasury increased in April, starting at 4.71% and rising to 4.94%.
Rate Cuts Likely Delayed
The stock market took a pause in April as enthusiasm over strong earnings reports from technology leaders Microsoft and Alphabet was offset by worries over inflation. The Consumer Price Index rose 3.5% in March from a year earlier, according to the Labor Department. That was higher than economists’ estimates and a noticeable increase from February’s 3.2%. Core prices, which exclude volatile food and energy prices, rose 0.4% from the previous month, which was also higher than forecast. The report was especially concerning because inflation readings in January and February were hotter than expected as well. The latest report is widely viewed as taking Federal Reserve rate cuts off the table in the near term, with traders pushing back expectations for a first cut until November or December. The Fed’s preferred inflation gauge, the Personal Consumption Expenditures price index, rose 2.7% in March from a year earlier, while the closely watched core PCE rose 2.8%.
Gross domestic product grew 1.6% on an annual basis in the first quarter, down from 3.4% the previous quarter and the weakest performance for the U.S. economy since the undeclared recession in the first half of 2022. Few economists expect a recession in the near future, but the economy has slowed noticeably from the 4.9% growth in the middle of 2023. Consumer spending was one bright spot, increasing 2.5%, but the report also showed a reversal of progress against inflation. The PCE rose 3.4% in the quarter after three quarters below 3%.
Existing home sales in March fell 4.3% from February in what was the largest percentage decline on a monthly basis since November 2022, according to the National Association of Realtors. The average rate on the standard 30-year fixed mortgage jumped by nearly a quarter-percentage point to 7.1%. The rise in mortgage rates is cutting short what was a positive start to the year. The recent spike in borrowing costs, in addition to record home prices and skyrocketing insurance premiums, is making it less affordable to buy a home. The national median existing-home price rose 4.8% in March to $393,500.
U.S. retail sales rose a seasonally adjusted 0.7% in March in a sign that consumers continue to be optimistic and have money to spend.
Disclosures:
This market commentary is meant for informational and educational purposes only and does not consider any individual personal considerations. As such, the information contained herein is not intended to be personal investment advice or recommendation. References to specific asset classes are for illustrative purposes only.
The commentary represents an assessment of the market environment through April 2024. The views and opinions expressed may change based on the market or other conditions. The forward-looking statements are based on certain assumptions, but there can be no assurance that forward-looking statements will materialize. This commentary was written and provided by an unaffiliated third party; we cannot guarantee the accuracy or completeness of any statements or data contained herein.
Indexes are unmanaged and cannot be directly invested into. Past performance is no indication of future results. Investing involves risk and the potential to lose principal.
AdvicePeriod is another business name and brand utilized by both Mariner, LLC and Mariner Platform Solutions, LLC, each of which is an SEC registered investment adviser. Registration of an investment adviser does not imply a certain level of skill or training. Each firm is in compliance with the current notice filing requirements imposed upon SEC registered investment advisers by those states in which each firm maintains clients. Each firm may only transact business in those states in which it is notice filed or qualifies for an exemption or exclusion from notice filing requirements. Any subsequent, direct communication by an advisor with a prospective client shall be conducted by a representative that is either registered or qualifies for an exemption or exclusion from registration in the state where the prospective client resides. For additional information about Mariner, LLC or Mariner Platform Solutions, LLC, including fees and services, please contact us utilizing the contact information provided herein or refer to the Investment Adviser Public Disclosure website (www.adviserinfo.sec.gov). Please read the disclosure statement carefully before you invest or send money.
For additional information as to which entity your adviser is registered as an investment adviser representative, please refer to the Investment Adviser Public Disclosure website (www.adviserinfo.sec.gov) or the Form ADV 2B provided to you. Investment adviser representatives of Mariner, LLC dba Mariner Wealth Advisors and dba AdvicePeriod are generally employed by Mariner Wealth Advisors, LLC. Investment adviser representatives of Mariner Platform Solutions, LLC dba AdvicePeriod, are independent contractors.
Index Definitions: The S&P 500 is a capitalization-weighted index designed to measure the performance of the broad domestic economy through changes in the aggregate market value of 500 stocks representing all major industries. Russell 2000 consists of the 2,000 smallest U.S. companies in the Russell 3000 index. MSCI EAFE is an equity index which captures large and mid-cap representation across Developed Markets countries around the world, excluding the U.S. and Canada. The index covers approximately 85% of the free float-adjusted market capitalization in each country. MSCI Emerging Markets captures large and mid-cap representation across Emerging Markets countries. The index covers approximately 85% of the free-float adjusted market capitalization in each country. Bloomberg U.S. Aggregate Index covers the U.S. investment grade fixed rate bond market, with index components for government and corporate securities, mortgage pass-through securities, and asset-backed securities. Bloomberg U.S. Corporate High Yield Index covers the universe of fixed rate, non-investment grade debt. Eurobonds and debt issues from countries designated as emerging markets (sovereign rating of Baa1/BBB+/BBB+ and below using the middle of Moody’s, S&P, and Fitch) are excluded, but Canadian and global bonds (SEC registered) of issuers in non-EMG countries are included. FTSE NAREIT Equity REITs Index contains all Equity REITs not designed as Timber REITs or Infrastructure REITs. Bloomberg Commodity Index is calculated on an excess return basis and reflects commodity futures price movements. The index rebalances annually weighted 2/3 by trading volume, and 1/3 by world production and weight-caps are applied at the commodity, sector, and group level for diversification.
Does past performance matter?
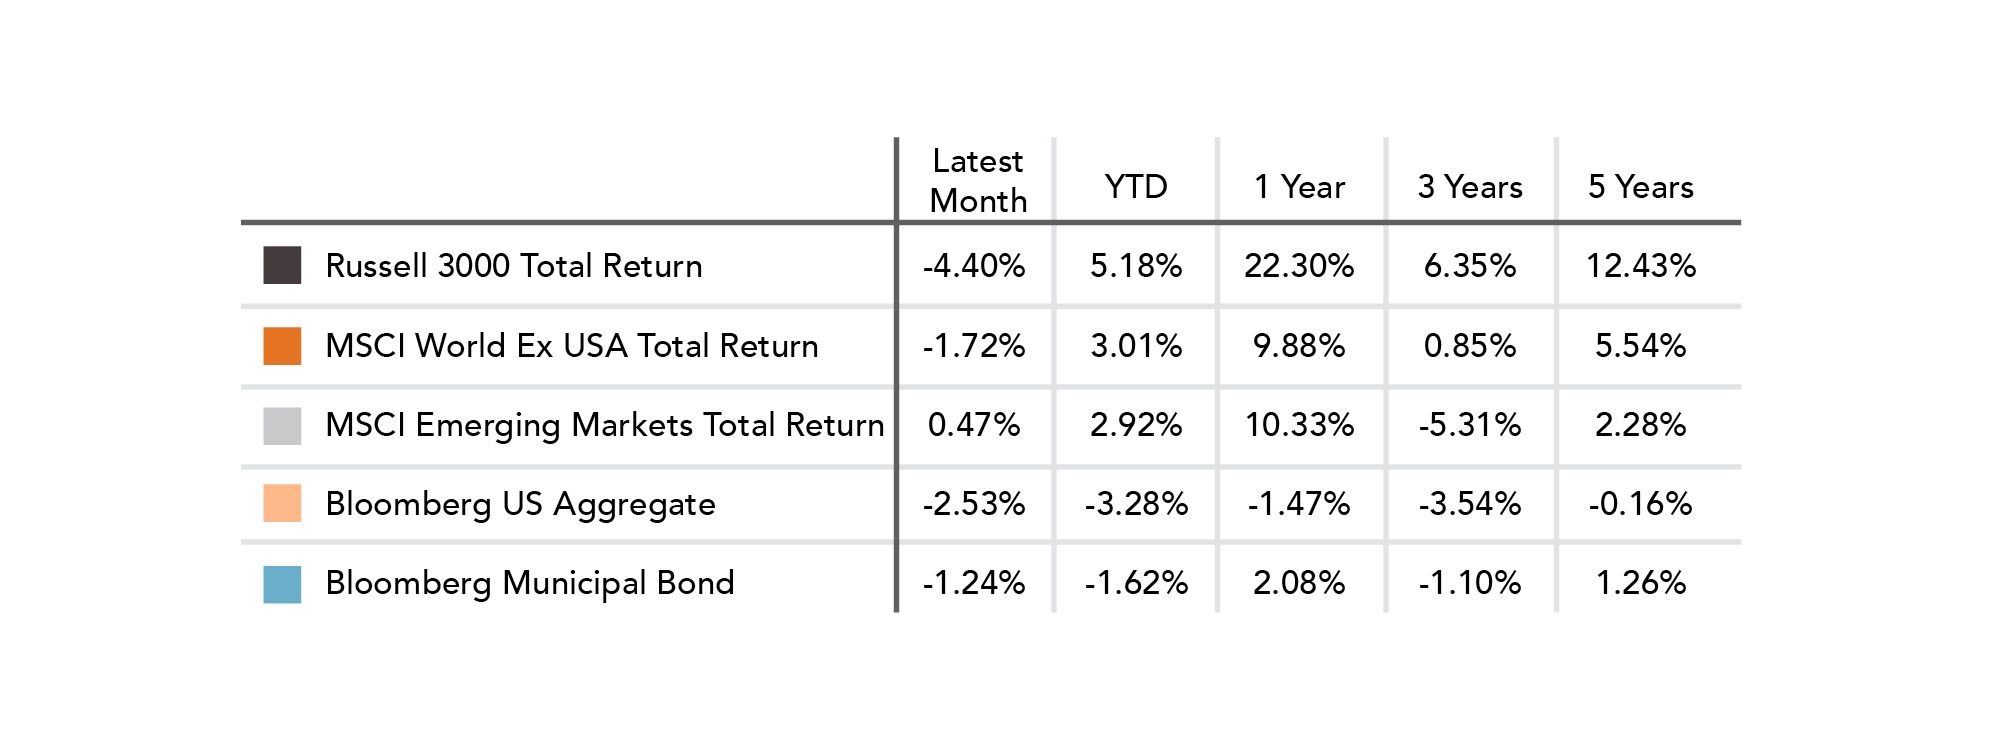
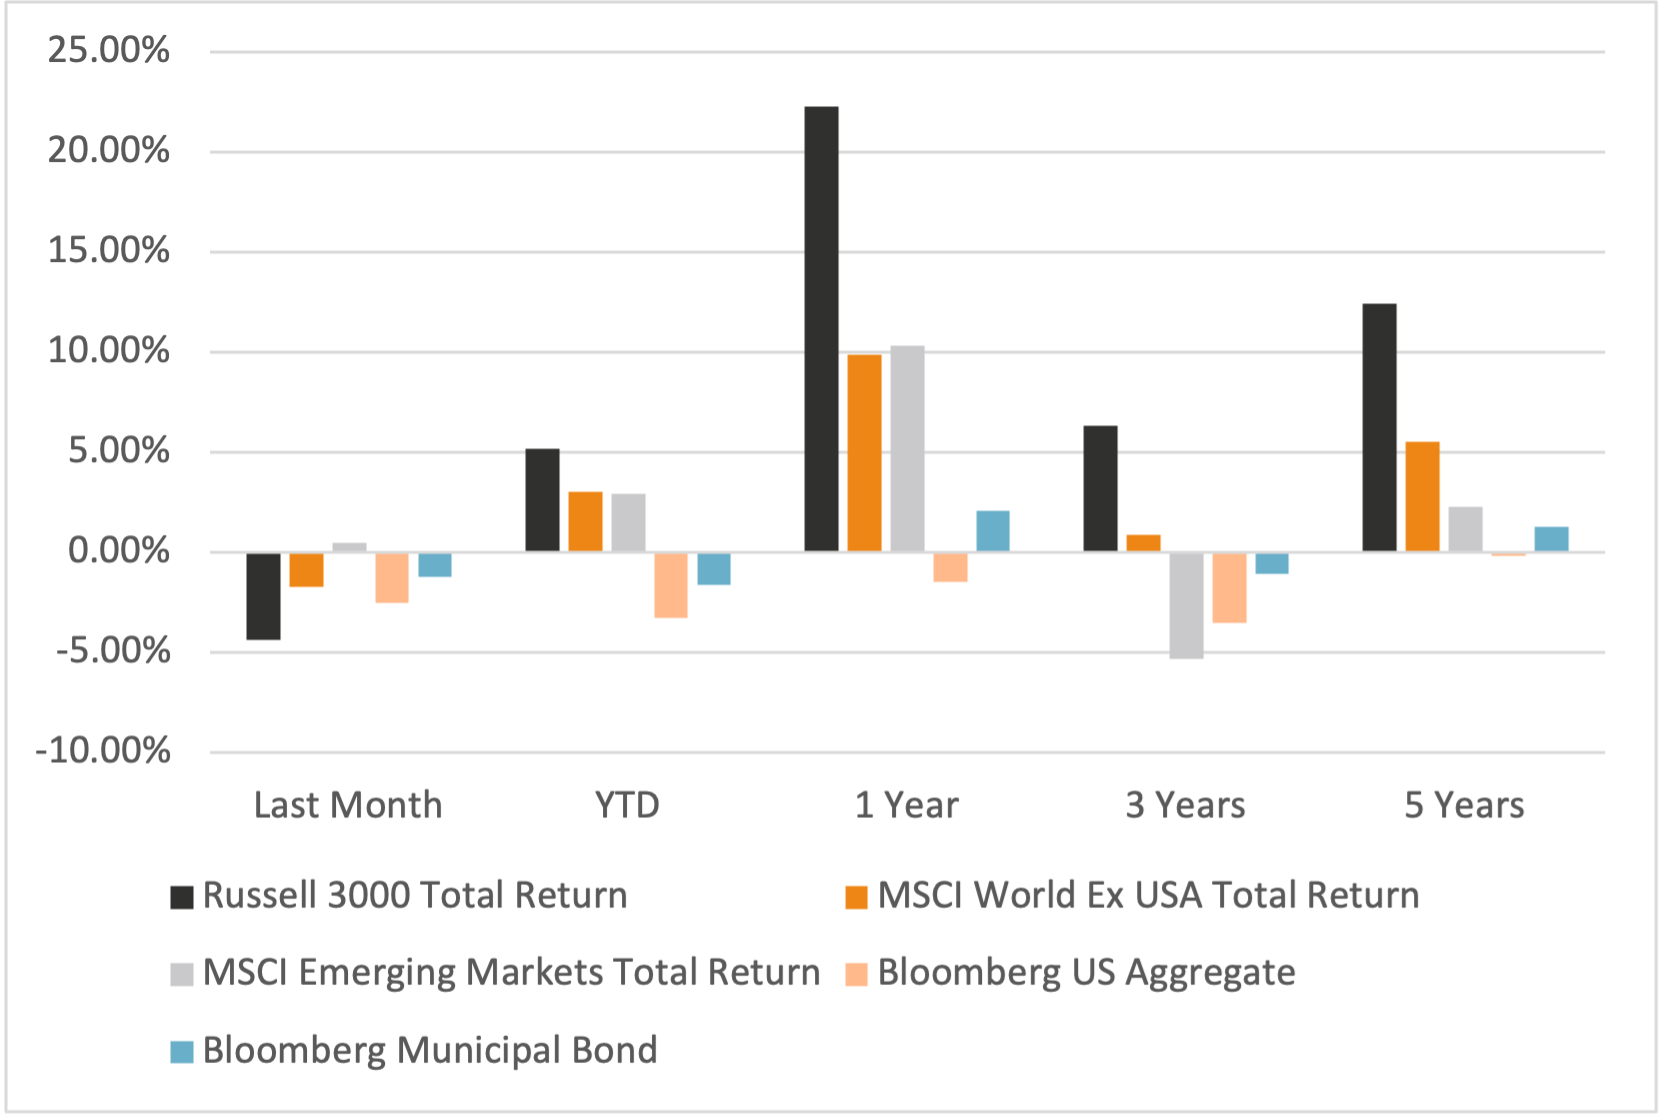
Major Market Index Returns
Period Ending 5/1/2024
Multi-year returns are annualized.
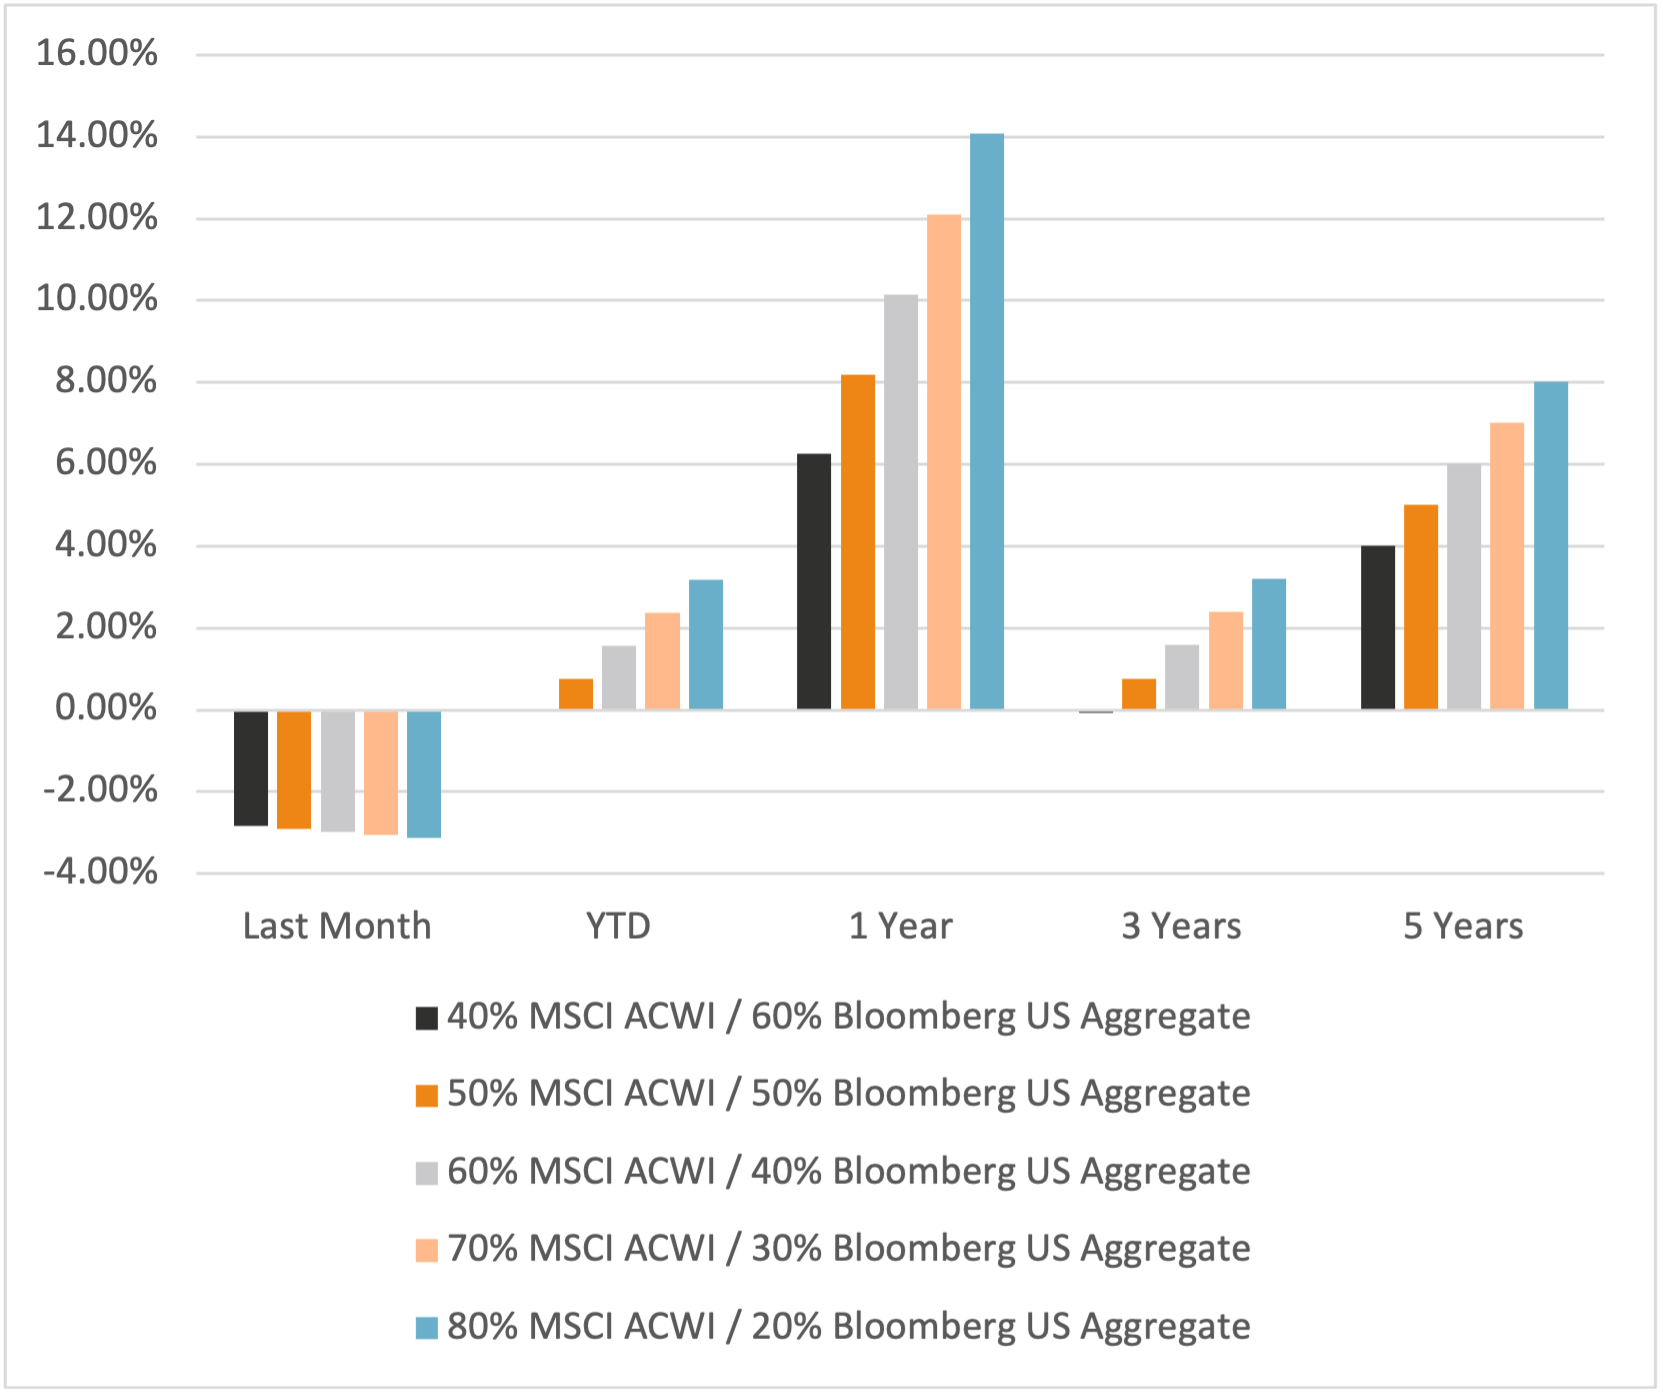
Mix Index Returns
Global Equity / US Taxable Bonds
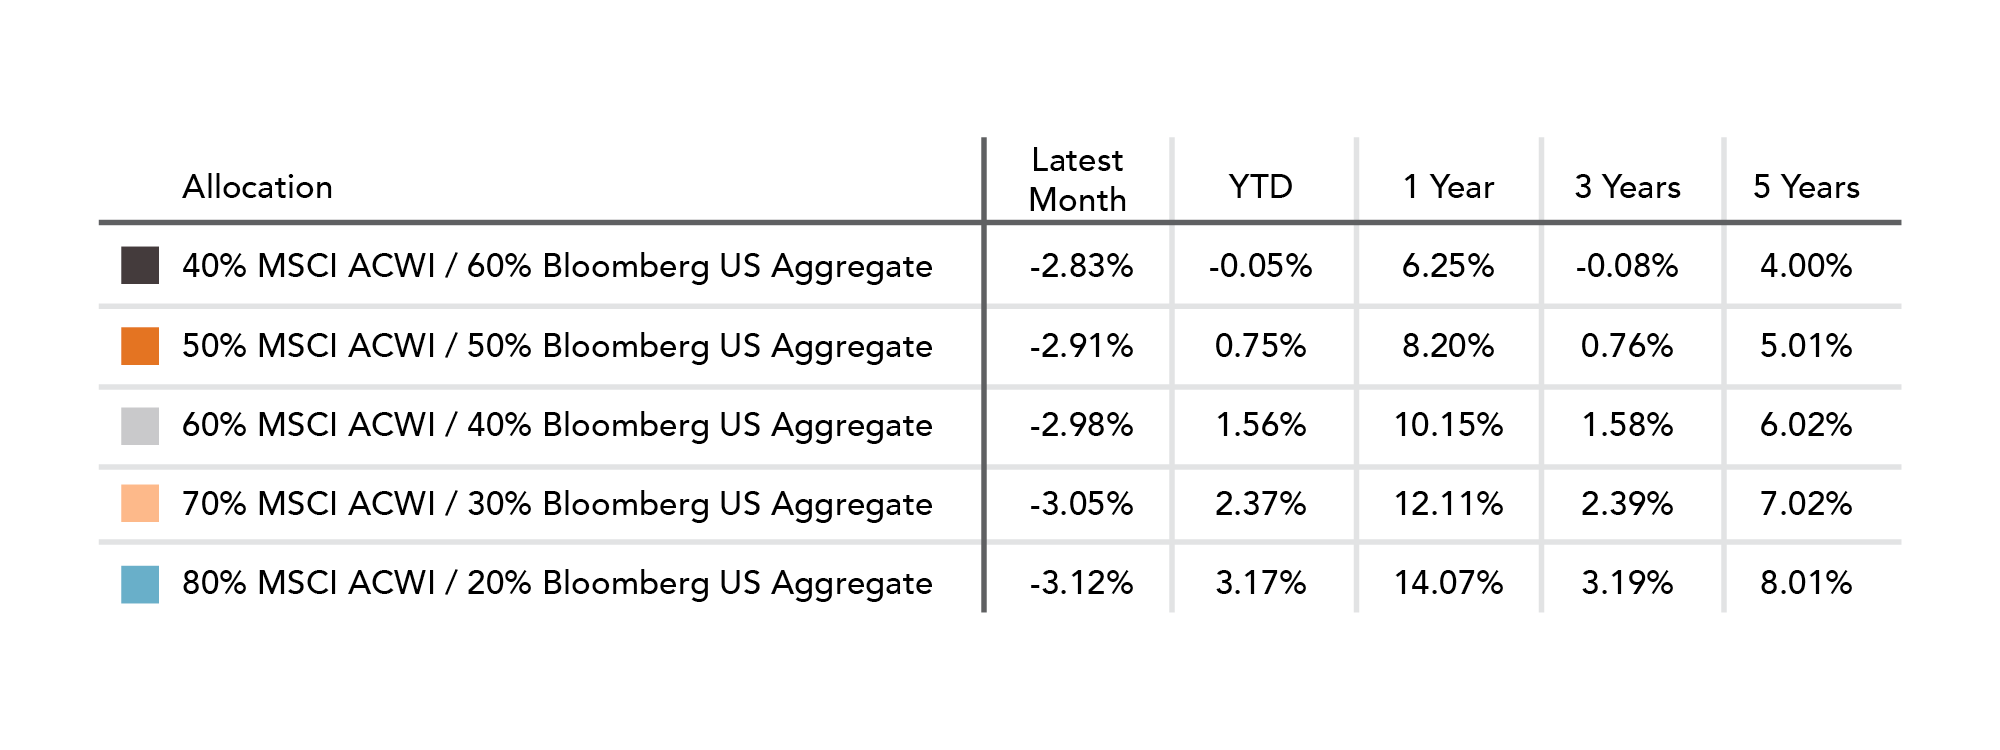
Indexes are unmanaged and cannot be directly invested into. Past performance is no indication of future results. Investing involves risk and the potential to lose principal.
The Russell 3000 Index is a United States market index that tracks the 3000 largest companies. MSCI Emerging Markets Index is a broad market cap-weighted Index showing the performance of equities across 23 emerging market countries defined as emerging markets by MSCI. MSCI ACWI ex-U.S. Index is a free-float adjusted market capitalization-weighted index that is designed to measure the equity market performance of developed and emerging markets excluding companies based in the United States. Bloomberg U.S. Aggregate Bond Index represents the investment-grade, U.S. dollar-denominated, fixed-rate taxable bond market, including Treasuries, government-related and corporate securities, as well as mortgage and asset-backed securities. Bloomberg Municipal Index is the US Municipal Index that covers the US dollar-denominated long-term tax-exempt bond market. The index has four main sectors: state and local general obligation bonds, revenue bonds, insured bonds, and prerefunded bonds.


April 2024 Market Commentary