Please find our most recent market review below. We hope these perspectives are valuable to you.
– The AdvicePeriod Team
Stocks Continue Their Strong Start to 2024
Low unemployment, solid job gains and easing inflation continue to point toward a soft-landing scenario, leading to positive performance for all asset classes in the month of March.
Key Observations
- The S&P 500 gained 3.2% in March and is up 10.6% in 2024.
- Small-cap stocks rose 3.6% and mid-cap stocks gained 4.3% for the month.
- Bonds bounced back from their slow start to the year and returned 0.9%.
- International developed markets were up 3.3%, and emerging markets gained 2.5%.
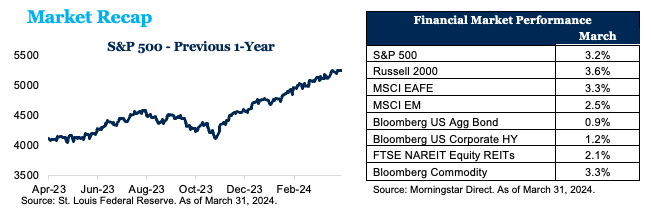
The U.S. stock market continued its strong start to the year, returning 3.2% in March. Market leadership moved from large growth technology stocks to mid-cap value stocks, which led the way for the month, returning 5.2% versus large growth stocks’ return of 1.8%. The S&P 500 is now up 10.6% in 2024 and nearly 30% over the previous one-year period. Small-cap stocks returned 3.6%, topping large caps. Non-U.S. developed equities returned 3.3%, outpacing the S&P 500 by a small margin. Emerging markets lagged developed markets, returning only 2.5%. The Bloomberg U.S. Aggregate Bond Index was up 0.9% for the month, while the 10-year Treasury yield was relatively flat, starting the month at 4.18% and ending the month at 4.21%. Yields on the 2-year Treasury increased in February, starting at 4.54% and rising to 4.63%. High-yield bond yields rose 1.2%.
Rate Cuts Still Expected
The stock market responded with enthusiasm when a narrow majority of Federal Reserve officials reaffirmed projections to cut interest rates three times this year despite firmer-than-expected inflation numbers. Fed Chair Jerome Powell said his outlook for inflation to continue falling hasn’t changed substantially in recent weeks. Most of his colleagues continue to expect two or three rate cuts this year. The central bank held its benchmark federal funds rate steady in a range between 5.25% and 5.5%, a 23-year high. Only two of 19 officials projected no cuts this year, and another two penciled in just one cut. A majority expect a modestly slower pace of rate cuts next year, with their benchmark rate settling at just below 4% at the end of 2025 and slightly above 3% after that. The 30-year fixed rate mortgage stood at roughly 6.7% last week, down from an October high of 7.8%, according to Freddie Mac.
Sales of previously owned homes surged 9.5% in February, marking the first time in more than two years that sales increased in two consecutive months. The momentum in sales over the last two months follows one of the most sluggish periods for the housing market in recent history. The most expensive homes saw the biggest increases in sales. Homes sold for more than $1 million shot up 37% in February compared with the same month a year ago. Home buyers in February also benefited from a more than 10% increase in the number of homes available for sale compared with the same month a year ago, according to the National Association of Realtors.
U.S. retail sales rose a seasonally adjusted 0.6% in February compared with a month earlier, according to the Commerce Department. Economists had expected a 0.8% increase. Consumer spending in February was still robust but not as strong as economists were hoping.
The Consumer Price Index rose 3.2% in February from a year earlier, according to the Labor Department. Core prices, which strip out volatile food and energy components, rose 3.8% on an annual basis.
Meanwhile, the Fed’s preferred inflation gauge, the Personal Consumption Expenditures Index, rose just 2.5% over the 12 months through February, according to the Commerce Department. The core rate, which strips out volatile food and energy prices, increased 2.8% from a year earlier. The PCE report is a continuation of a trend that saw inflation decline at a much faster rate than the Fed and economists anticipated.
Low unemployment, solid job gains and easing inflation are consistent with a so-called soft landing, when inflation cools without triggering a recession.
Stepping Out of Cash
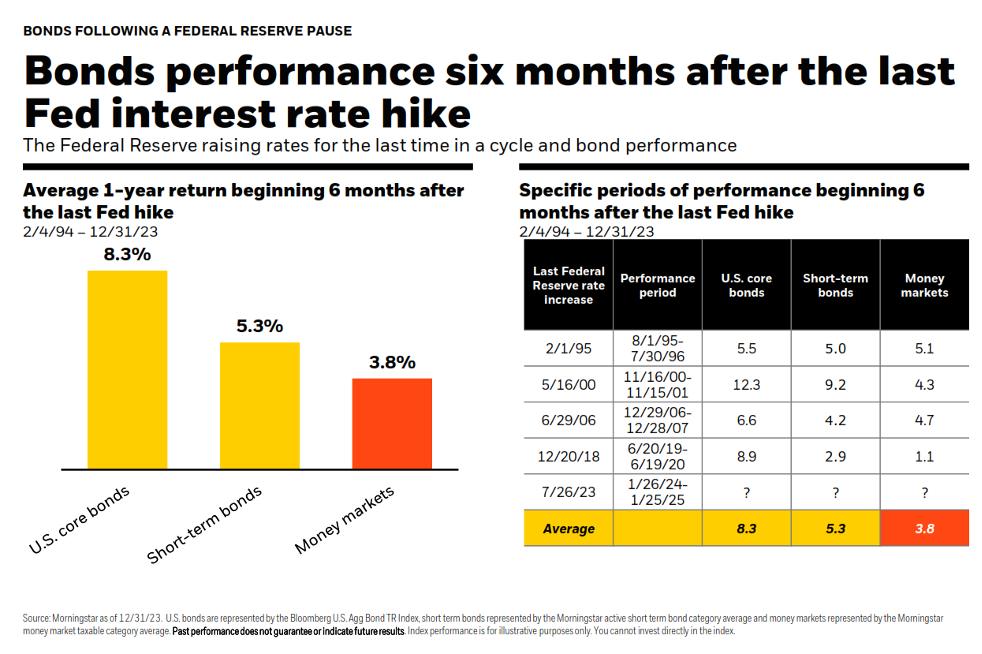
Market volatility and unusually high short-term rates have motivated many investors to move more of their savings into money market accounts and other short-term fixed income instruments. But this “free lunch” of high returns and low risk has the potential to disappoint investors if the Fed begins to cut interest rates. The table below shows what has happened historically once a rate-hiking cycle has ended.
The “Free Lunch” of High Short-Term Rates May End Soon
Disclosures:
This market commentary is meant for informational and educational purposes only and does not consider any individual personal considerations. As such, the information contained herein is not intended to be personal investment advice or recommendation. References to specific asset classes are for illustrative purposes only.
The commentary represents an assessment of the market environment through March 2024. The views and opinions expressed may change based on the market or other conditions. The forward-looking statements are based on certain assumptions, but there can be no assurance that forward-looking statements will materialize. This commentary was written and provided by an unaffiliated third party; we cannot guarantee the accuracy or completeness of any statements or data contained herein.
Investing in any fixed income securities are subject to risks, including, but not limited to, market, interest rate, issuer, credit, inflation, and liquidity risk. Changes in interest rates impact the value of most bonds and bond strategies. Investments may be worth more or less than the original cost if sold.
An investment in a money market fund is neither insured nor guaranteed by the FDIC or any other government agency. Although money market funds seek to preserve the value of your investment at $1.00 per share, it is possible to lose money by investing in these funds. Investors should consider the investment objective, risks, charges, and expenses carefully before investing. The prospectuses for the fund contain important information which should be read carefully before investing.
Indexes are unmanaged and cannot be directly invested into. Past performance is no indication of future results. Investing involves risk and the potential to lose principal.
AdvicePeriod is another business name and brand utilized by both Mariner, LLC and Mariner Platform Solutions, LLC, each of which is an SEC registered investment adviser. Registration of an investment adviser does not imply a certain level of skill or training. Each firm is in compliance with the current notice filing requirements imposed upon SEC registered investment advisers by those states in which each firm maintains clients. Each firm may only transact business in those states in which it is notice filed or qualifies for an exemption or exclusion from notice filing requirements. Any subsequent, direct communication by an advisor with a prospective client shall be conducted by a representative that is either registered or qualifies for an exemption or exclusion from registration in the state where the prospective client resides. For additional information about Mariner, LLC or Mariner Platform Solutions, LLC, including fees and services, please contact us utilizing the contact information provided herein or refer to the Investment Adviser Public Disclosure website (www.adviserinfo.sec.gov). Please read the disclosure statement carefully before you invest or send money.
For additional information as to which entity your adviser is registered as an investment adviser representative, please refer to the Investment Adviser Public Disclosure website (www.adviserinfo.sec.gov) or the Form ADV 2B provided to you. Investment adviser representatives of Mariner, LLC dba Mariner Wealth Advisors and dba AdvicePeriod are generally employed by Mariner Wealth Advisors, LLC. Investment adviser representatives of Mariner Platform Solutions, LLC dba AdvicePeriod, are independent contractors.
Index Definitions: The S&P 500 is a capitalization-weighted index designed to measure the performance of the broad domestic economy through changes in the aggregate market value of 500 stocks representing all major industries. Russell 2000 consists of the 2,000 smallest U.S. companies in the Russell 3000 index. MSCI EAFE is an equity index which captures large and mid-cap representation across Developed Markets countries around the world, excluding the U.S. and Canada. The index covers approximately 85% of the free float-adjusted market capitalization in each country. MSCI Emerging Markets captures large and mid-cap representation across Emerging Markets countries. The index covers approximately 85% of the free-float adjusted market capitalization in each country. Bloomberg U.S. Aggregate Index covers the U.S. investment grade fixed rate bond market, with index components for government and corporate securities, mortgage pass-through securities, and asset-backed securities. Bloomberg U.S. Corporate High Yield Index covers the universe of fixed rate, non-investment grade debt. Eurobonds and debt issues from countries designated as emerging markets (sovereign rating of Baa1/BBB+/BBB+ and below using the middle of Moody’s, S&P, and Fitch) are excluded, but Canadian and global bonds (SEC registered) of issuers in non-EMG countries are included. FTSE NAREIT Equity REITs Index contains all Equity REITs not designed as Timber REITs or Infrastructure REITs. Bloomberg Commodity Index is calculated on an excess return basis and reflects commodity futures price movements. The index rebalances annually weighted 2/3 by trading volume, and 1/3 by world production and weight-caps are applied at the commodity, sector, and group level for diversification.
Does past performance matter?
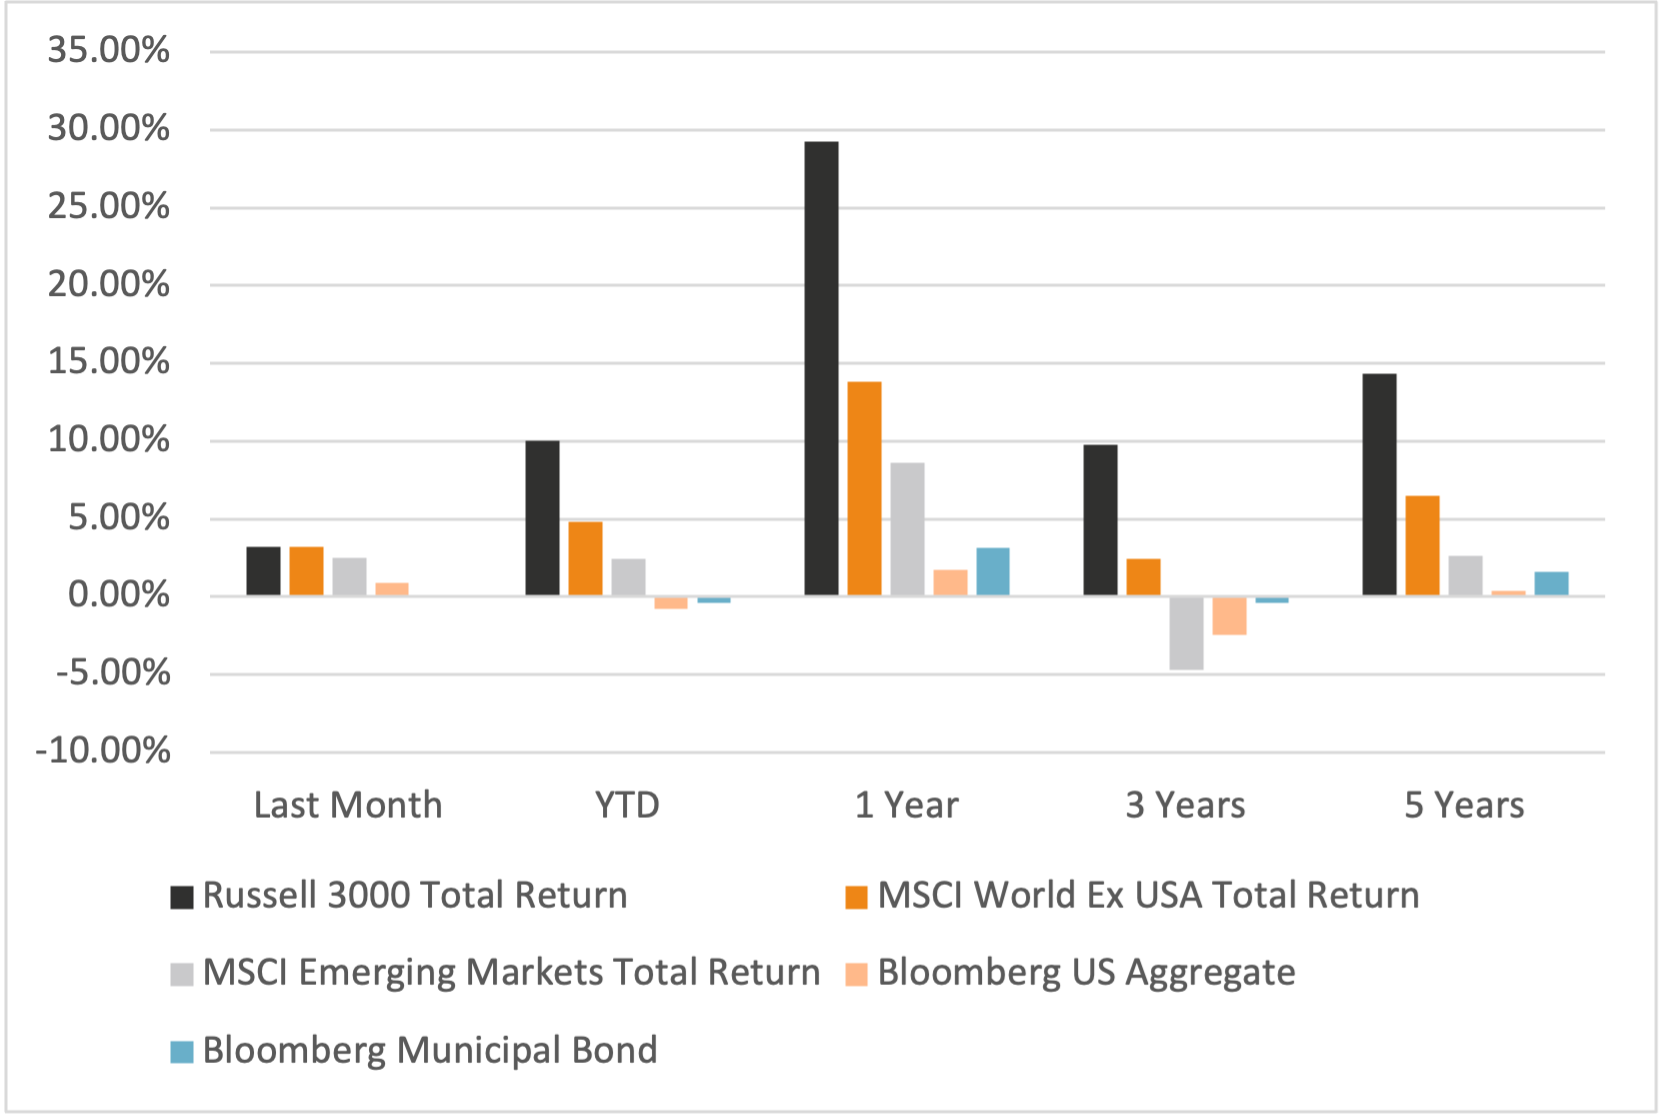
Major Market Index Returns
Period Ending 4/1/2024
Multi-year returns are annualized.
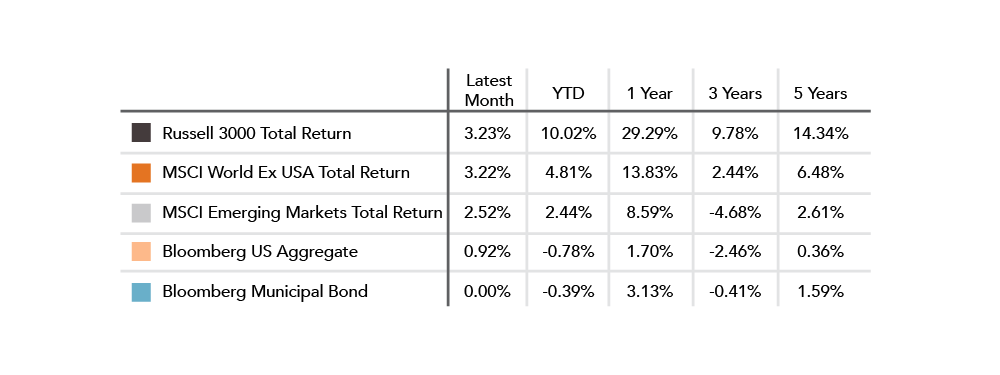
Mix Index Returns
Global Equity / US Taxable Bonds
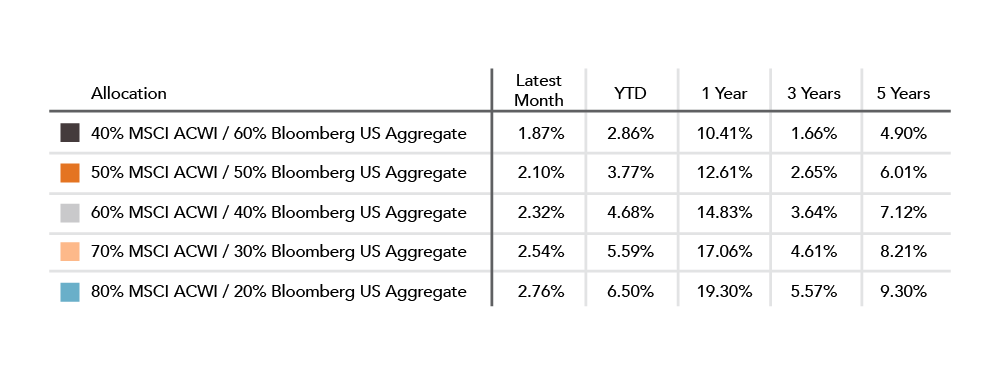
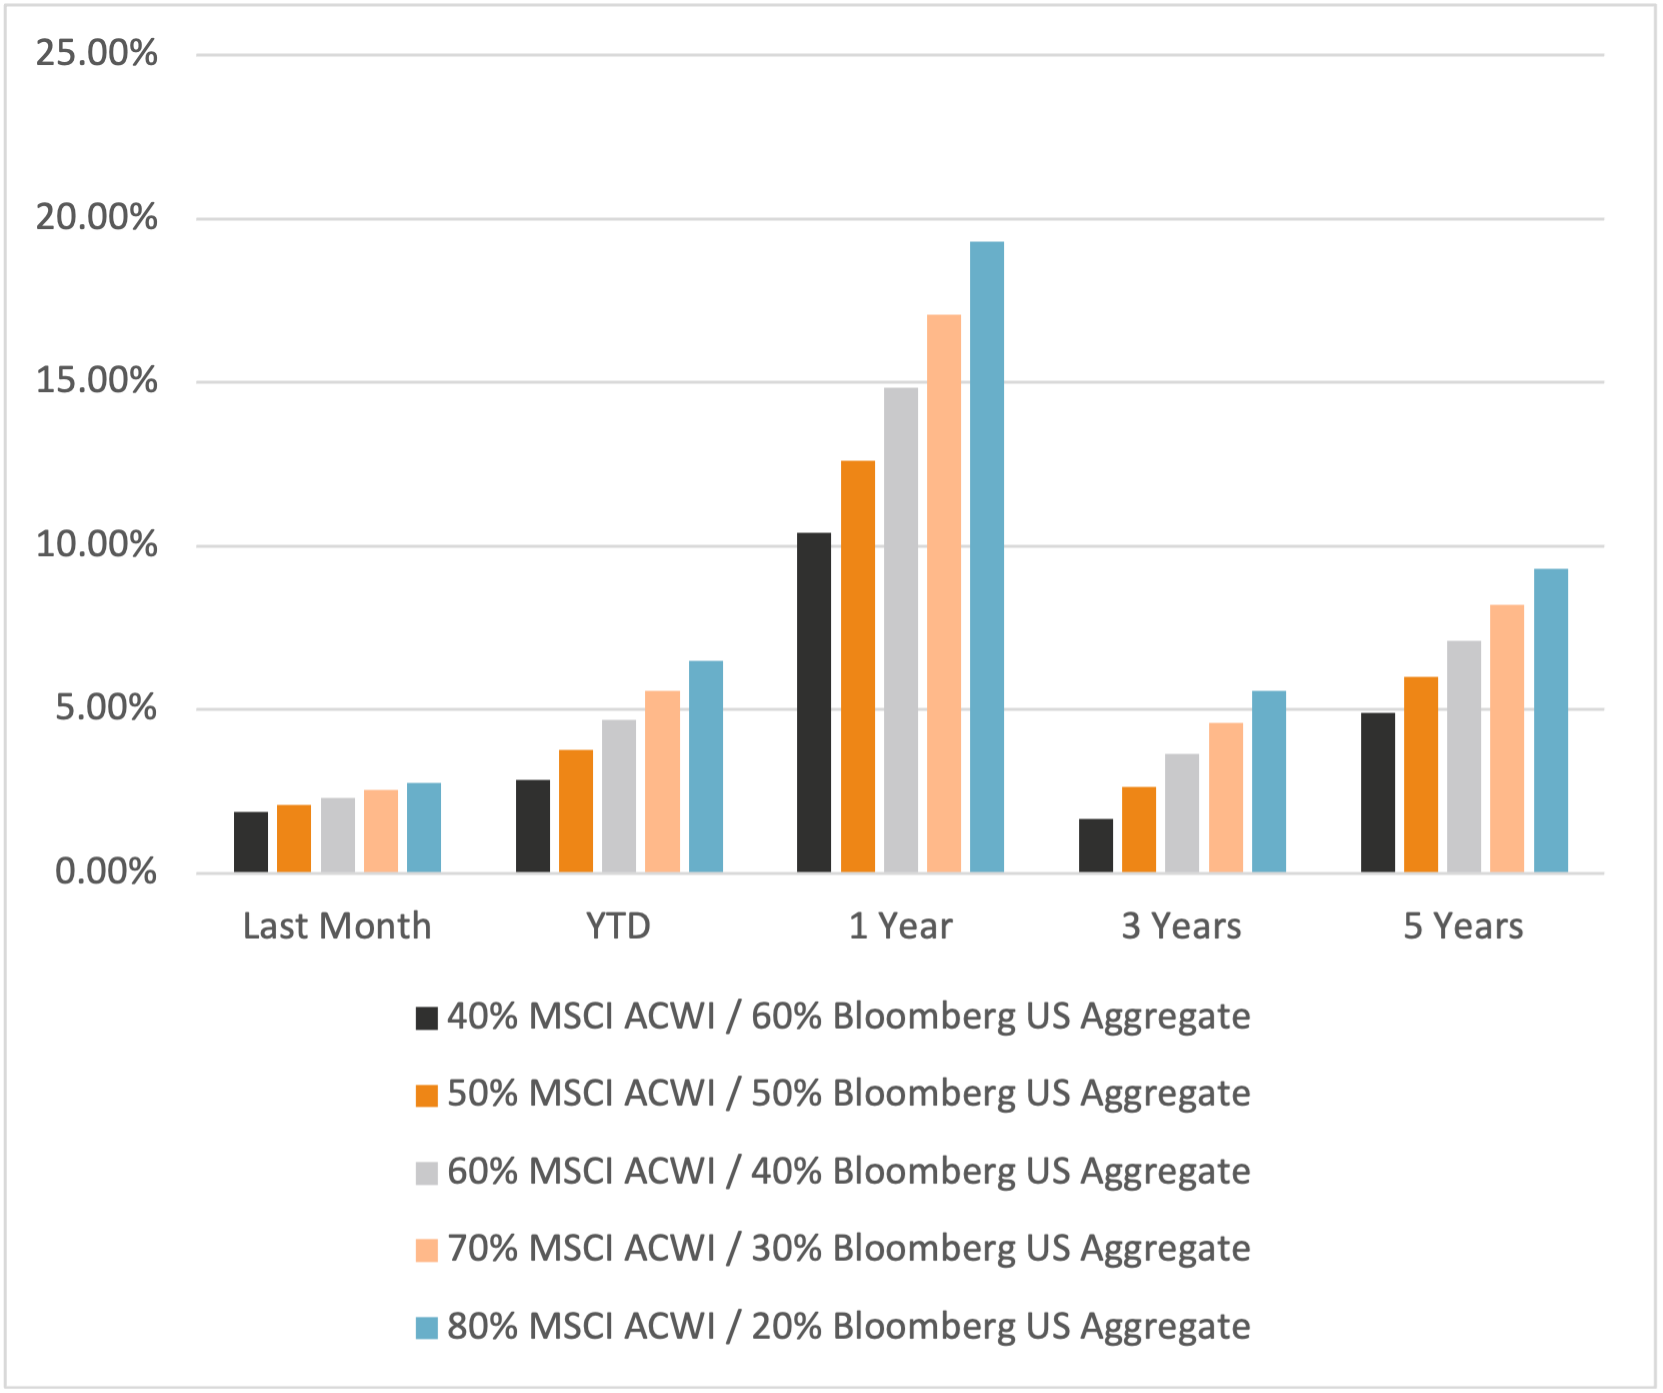
Indexes are unmanaged and cannot be directly invested into. Past performance is no indication of future results. Investing involves risk and the potential to lose principal.
The Russell 3000 Index is a United States market index that tracks the 3000 largest companies. MSCI Emerging Markets Index is a broad market cap-weighted Index showing the performance of equities across 23 emerging market countries defined as emerging markets by MSCI. MSCI ACWI ex-U.S. Index is a free-float adjusted market capitalization-weighted index that is designed to measure the equity market performance of developed and emerging markets excluding companies based in the United States. Bloomberg U.S. Aggregate Bond Index represents the investment-grade, U.S. dollar-denominated, fixed-rate taxable bond market, including Treasuries, government-related and corporate securities, as well as mortgage and asset-backed securities. Bloomberg Municipal Index is the US Municipal Index that covers the US dollar-denominated long-term tax-exempt bond market. The index has four main sectors: state and local general obligation bonds, revenue bonds, insured bonds, and prerefunded bonds.


March 2024 Market Commentary