Please find our most recent market review below. We hope these perspectives are valuable to you.
– The AdvicePeriod Team
Happy Start to the New Year
Economic data continues to support the “soft landing” scenario. Stocks continue to outpace bonds, with international stocks continuing to lag. Fed officials said it’s too early to declare victory but generally supported the idea that this rate cycle has likely peaked.
Key Observations
- The S&P 500 gained nearly 2% in January and is up almost 21% over the past 12 months.
- Small-cap stocks fell 3.9% and mid-cap stocks lost 1.4% for the month.
- Bonds ended the month down about 0.3%.
- International developed markets were roughly flat and emerging markets fell 4.6%.
Market Recap
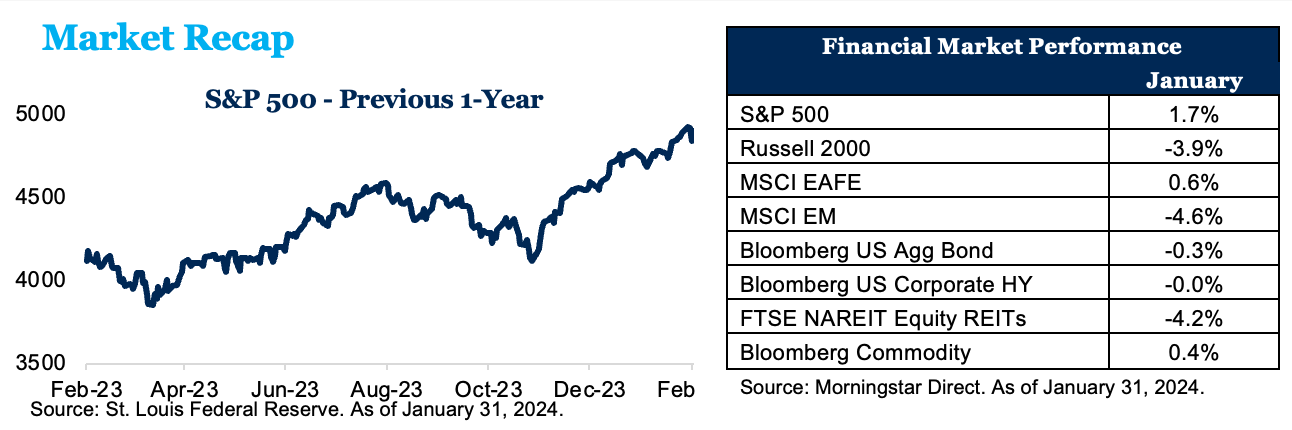 The stock market had another great month in January as it responded positively to favorable economic data. The S&P 500 gained nearly 2% and is now up almost 21% over the past 12 months. The Bloomberg U.S. Aggregate Bond Index was down 0.3% for the month, while the 10-year Treasury yield was roughly flat, starting and ending the month at 3.86%, despite peaking at 4.18% on January 23. Yields on the 2-year Treasury dropped in January, starting at 4.25% and falling to 4.19%. High-yield bonds were flat. Small- and mid-cap stocks fell 3.9% and 1.4%, respectively. International developed markets ended the month slightly positive, up 0.6%.
What Recession?
The recession that economists broadly feared in 2023 never showed up. The U.S. economy grew 3.1% over the past year, thanks to a resilient labor market that supported strong consumer spending. A year ago, economists surveyed by the Wall Street Journal saw a recession as very likely and projected 0.2% growth for the year. The year was capped by a fourth quarter in which the economy grew at a 3.3% seasonally and inflation-adjusted annualized pace, fueled by household and government spending. The final three months of the year looked a lot like the so-called soft landing Federal Reserve officials are trying to achieve. Growth was strong, while inflation cooled to an annualized rate of 1.7%, below the Fed’s target inflation rate of 2%.
Employers hired at a solid pace in December, ending a year of steady gains for the job market that continues to defy expectations. The U.S. economy added 216,000 jobs in December, with most industries increasing employment, according to the Labor Department. For all of 2023, employers added 2.7 million jobs, a slowdown from 4.8 million in 2022 but a better gain than in the several years preceding the pandemic. Wages rose a healthy 4.1% last month from a year earlier while the unemployment rate held steady at 3.7%. The jobless rate began 2023 at 3.4%, matching lows not seen since the late 1960s, and remains low despite inching higher late last year.
After two years of soaring home sales that started during the pandemic, the housing market skidded to a halt last year. Home sales last year dropped to the lowest level in nearly three decades after elevated mortgage rates and a lack of homes for sale frustrated buyers. Existing-home sales dropped 19% in 2023 from the prior year to 4.09 million, according to the National Association of Realtors. That total was lower than during the subprime crisis and the lowest full-year level since 1995.
U.S. retail sales rose a seasonally adjusted 0.6% in December from a month earlier, according to the Commerce Department. The larger-than-expected gain came after a healthy 0.3% increase in November. From a year earlier, retail sales rose a healthy 5.6% in December. Americans spent more on vehicles, clothing, at department stores and online. Holiday sales during November and December reached a record $964.4 billion, not adjusted for inflation, according to the National Retail Federation.
The Consumer Price Index rose 3.4% in December from a year earlier. Core prices, which strip out volatile food and energy components, rose 0.3% from the prior month. Core inflation was up 3.9% from a year earlier. Meanwhile, the Fed’s preferred inflation gauge, the core Personal Consumption Expenditures Index (PCE), which strips out volatile food and energy prices, increased 2.9% in December from a year earlier, according to the Bureau of Economic Analysis. Core PCE advanced 0.2% from a month ago. The PCE report caps a year that saw inflation decline at a much faster rate than the Fed and economists anticipated. Prices were up 2.6% for the year, not far from the Fed’s 2% target. Core prices were up just 1.9% on a six-month annualized basis.
Low unemployment, moderating job gains and easing inflation are consistent with a soft landing, where inflation cools without triggering a recession.
How to Maintain a Long-Term Perspective
What surprises will 2024 bring us? How might the election impact the markets? Will the Fed be successful in its efforts to engineer a soft landing for the economy? Everyone’s favorite parlor game is trying to guess the short-term direction of the stock market but, as you can see from the chart below, the performance of the stock market in any given year is unpredictable and totally random.
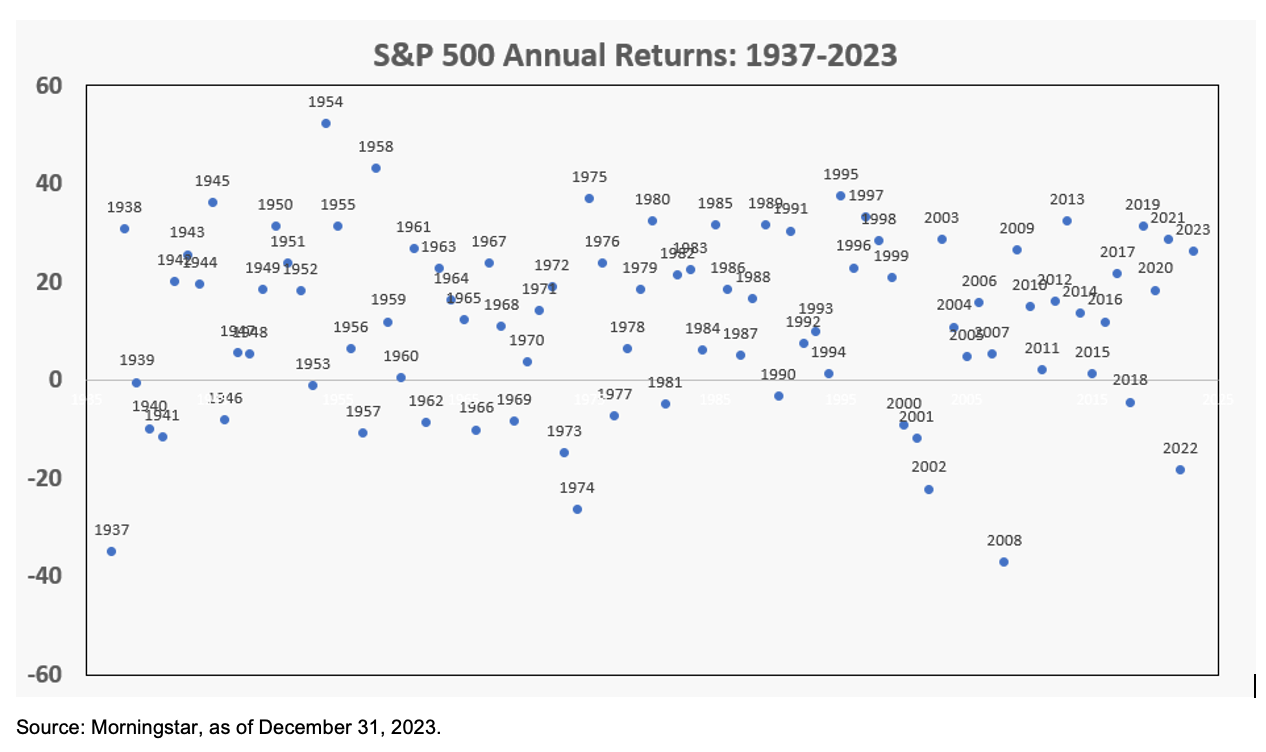 The bad news is we don’t know how the stock market will perform this year. The good news is investors don’t need to know that to be successful in achieving long-term financial goals.
The chart below shows that the stock market over long periods of time has provided returns in a relatively narrow band.
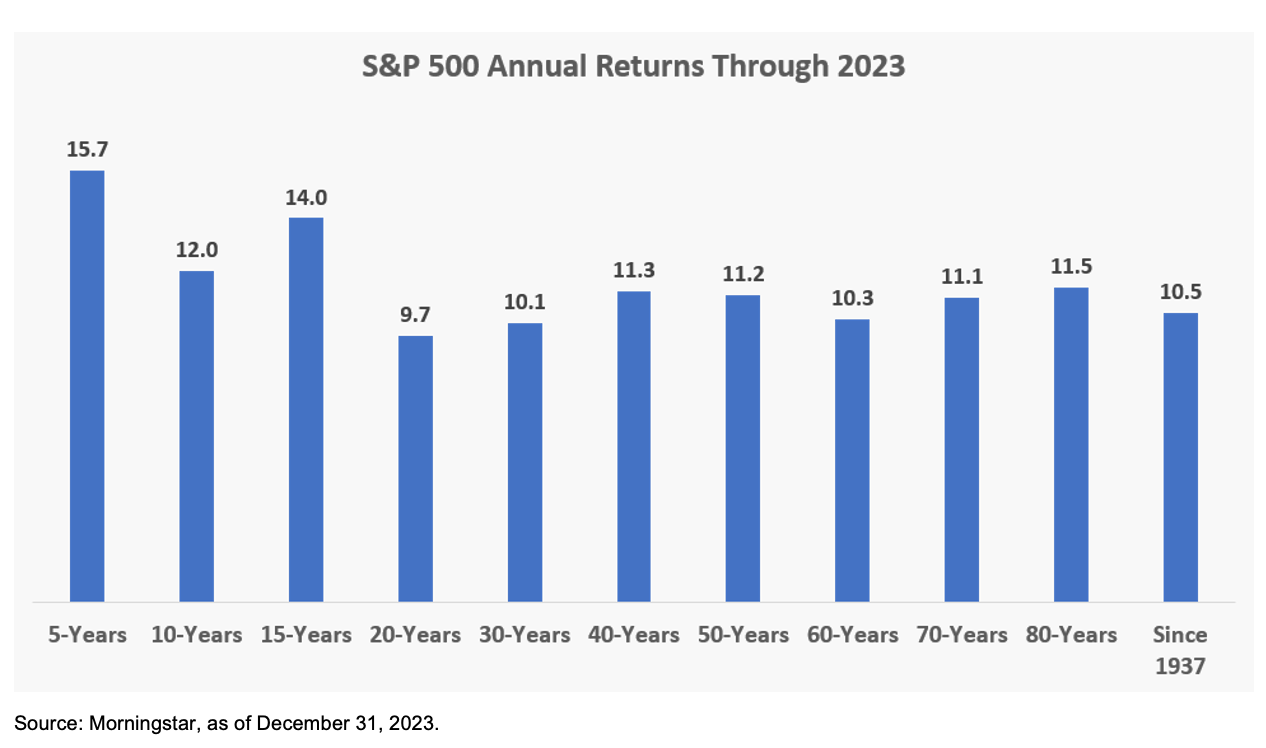 Of course, no one can say for certain whether the future will look like the past, but understanding why the stock market has provided solid returns in the past may give you a bit more confidence in the future. We think there are four primary reasons for these impressive returns:
- Over the long term, corporate profits have acted like a magnet to pull stock prices higher. As earnings grow, the value of companies has generally increased.
- Companies often return a portion of their profits to shareholders in the form of dividends, which has added to investors’ returns.
- Well-managed companies can often raise prices to offset the higher cost of doing business. These price increases often lead to higher earnings and dividends.
- Stocks are risky to own because earnings, dividends and returns are not guaranteed. For this reason, shareholders often demand a higher return on their investment to offset the higher risk.
Wharton professor Jeremy Siegel, author of “Stocks for the Long Run,” likes to say, “Stocks are the most volatile asset in the short run, but the most stable asset in the long run.” That is why we believe for most investors with long-term goals, common stocks should represent a healthy portion of the investor’s portfolio.
Disclosures:
This market commentary is meant for informational and educational purposes only and does not consider any individual personal considerations. As such, the information contained herein is not intended to be personal investment advice or recommendation. Please consult a financial professional before making any financial-related decisions.
The commentary represents an assessment of the market environment through January 2024. The views and opinions expressed may change based on the market or other conditions. The forward-looking statements are based on certain assumptions, but there can be no assurance that forward-looking statements will materialize. This commentary was written and provided by an unaffiliated third party; we cannot guarantee the accuracy or completeness of any statements or data contained herein.
Indexes are unmanaged and cannot be directly invested into. Past performance is no indication of future results. Investing involves risk and the potential to lose principal.
AdvicePeriod is another business name and brand utilized by both Mariner, LLC and Mariner Platform Solutions, LLC, each of which is an SEC registered investment adviser. Registration of an investment adviser does not imply a certain level of skill or training. Each firm is in compliance with the current notice filing requirements imposed upon SEC registered investment advisers by those states in which each firm maintains clients. Each firm may only transact business in those states in which it is notice filed or qualifies for an exemption or exclusion from notice filing requirements. Any subsequent, direct communication by an advisor with a prospective client shall be conducted by a representative that is either registered or qualifies for an exemption or exclusion from registration in the state where the prospective client resides. For additional information about Mariner, LLC or Mariner Platform Solutions, LLC, including fees and services, please contact us utilizing the contact information provided herein or refer to the Investment Adviser Public Disclosure website (www.adviserinfo.sec.gov). Please read the disclosure statement carefully before you invest or send money.
For additional information as to which entity your adviser is registered as an investment adviser representative, please refer to the Investment Adviser Public Disclosure website (www.adviserinfo.sec.gov) or the Form ADV 2B provided to you. Investment adviser representatives of Mariner, LLC dba Mariner Wealth Advisors and dba AdvicePeriod are generally employed by Mariner Wealth Advisors, LLC. Investment adviser representatives of Mariner Platform Solutions, LLC dba AdvicePeriod, are independent contractors.
Index Definitions: The S&P 500 is a capitalization-weighted index designed to measure the performance of the broad domestic economy through changes in the aggregate market value of 500 stocks representing all major industries. Russell 2000 consists of the 2,000 smallest U.S. companies in the Russell 3000 index. MSCI EAFE is an equity index which captures large and mid-cap representation across Developed Markets countries around the world, excluding the U.S. and Canada. The index covers approximately 85% of the free float-adjusted market capitalization in each country. MSCI Emerging Markets captures large and mid-cap representation across Emerging Markets countries. The index covers approximately 85% of the free-float adjusted market capitalization in each country. Bloomberg U.S. Aggregate Index covers the U.S. investment grade fixed rate bond market, with index components for government and corporate securities, mortgage pass-through securities, and asset-backed securities. Bloomberg U.S. Corporate High Yield Index covers the universe of fixed rate, non-investment grade debt. Eurobonds and debt issues from countries designated as emerging markets (sovereign rating of Baa1/BBB+/BBB+ and below using the middle of Moody’s, S&P, and Fitch) are excluded, but Canadian and global bonds (SEC registered) of issuers in non-EMG countries are included. FTSE NAREIT Equity REITs Index contains all Equity REITs not designed as Timber REITs or Infrastructure REITs. Bloomberg Commodity Index is calculated on an excess return basis and reflects commodity futures price movements. The index rebalances annually weighted 2/3 by trading volume, and 1/3 by world production and weight-caps are applied at the commodity, sector, and group level for diversification.
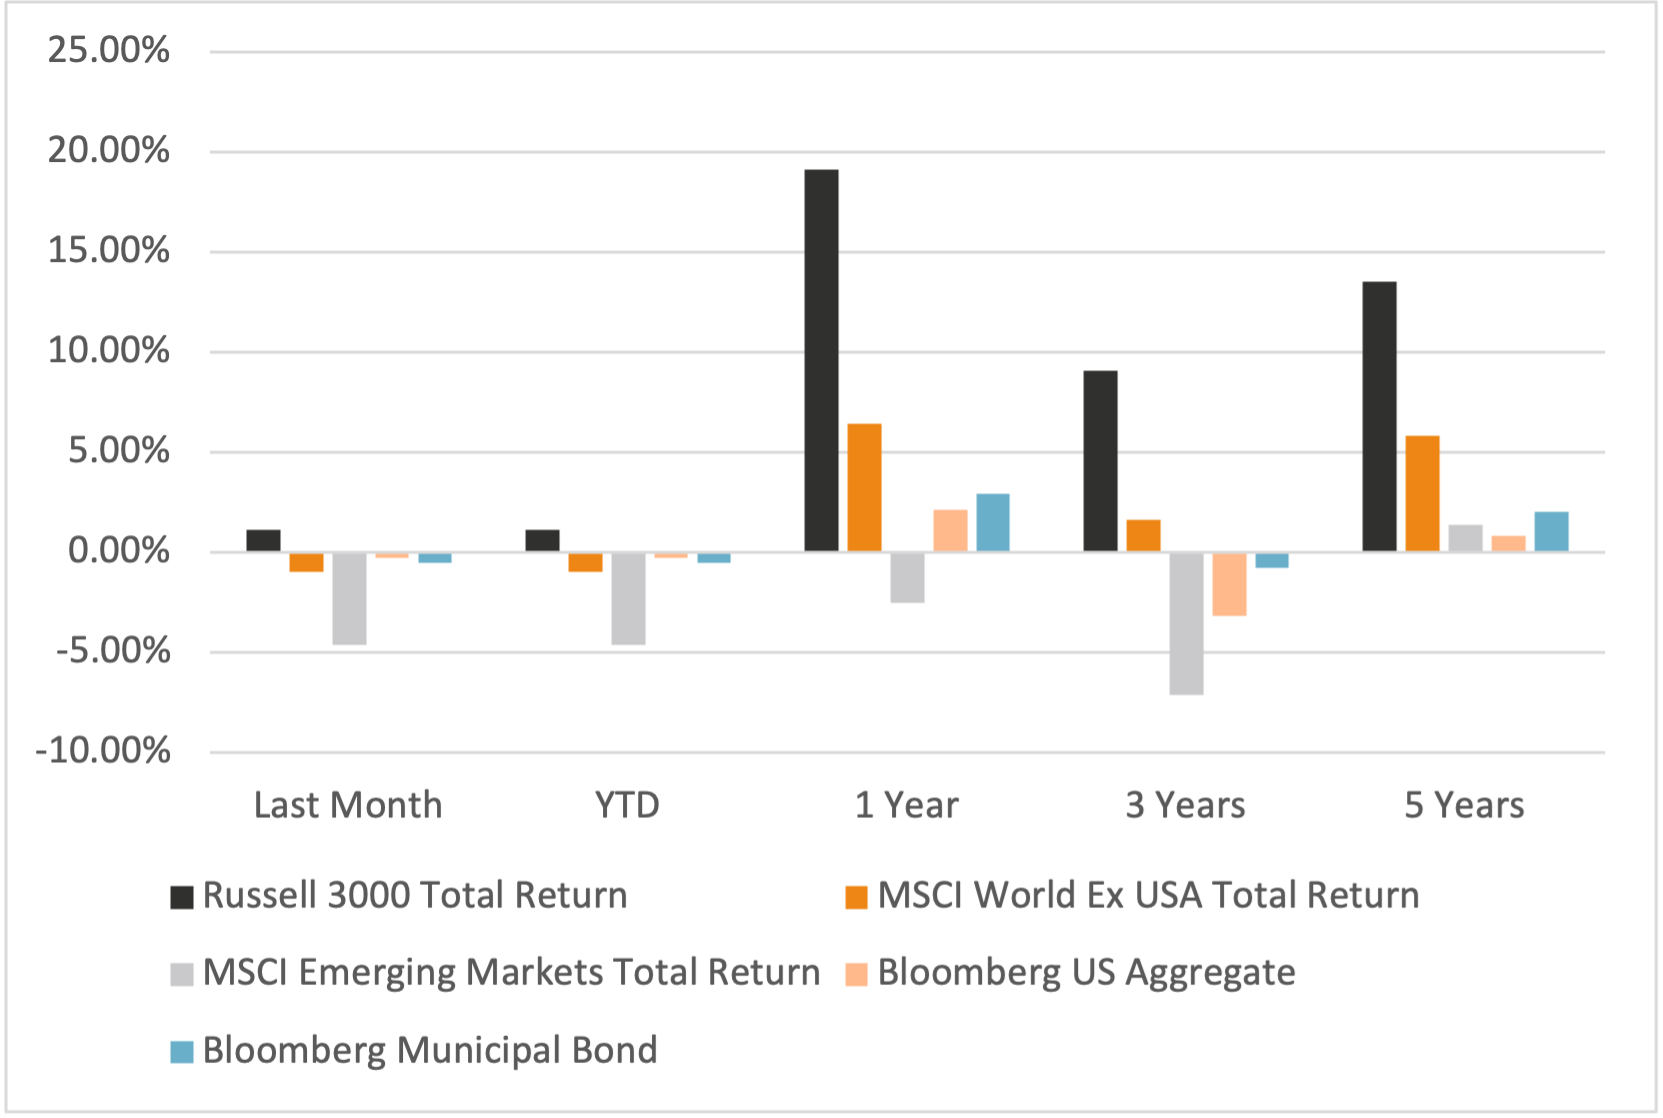
Does past performance matter?
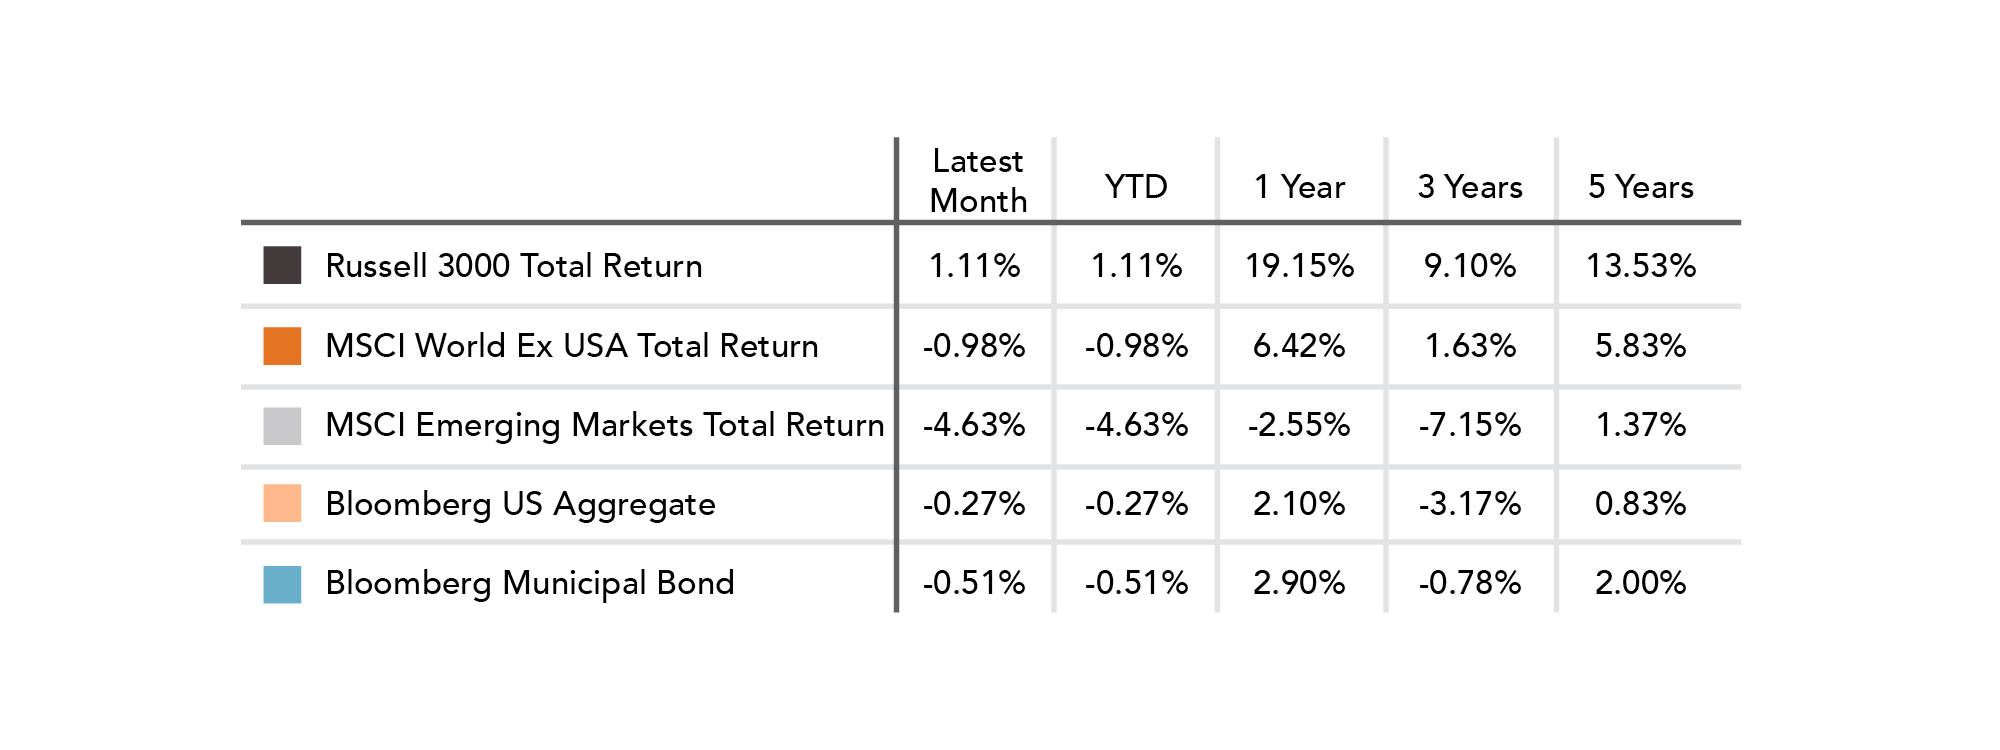
Major Market Index Returns
Period Ending 2/1/2024
Multi-year returns are annualized.
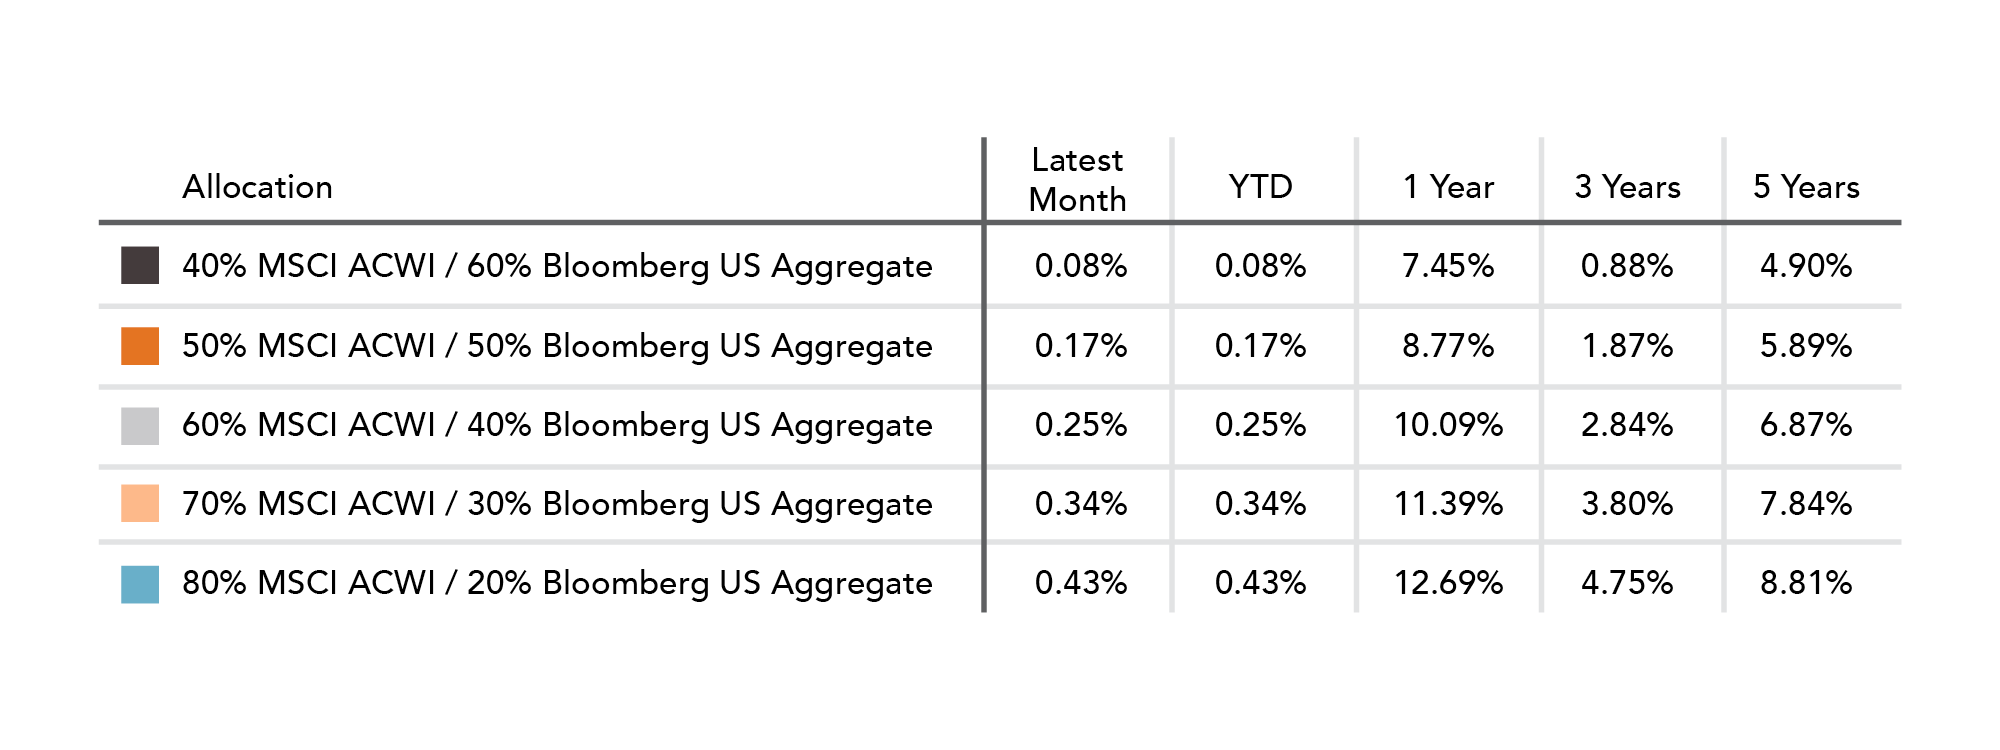
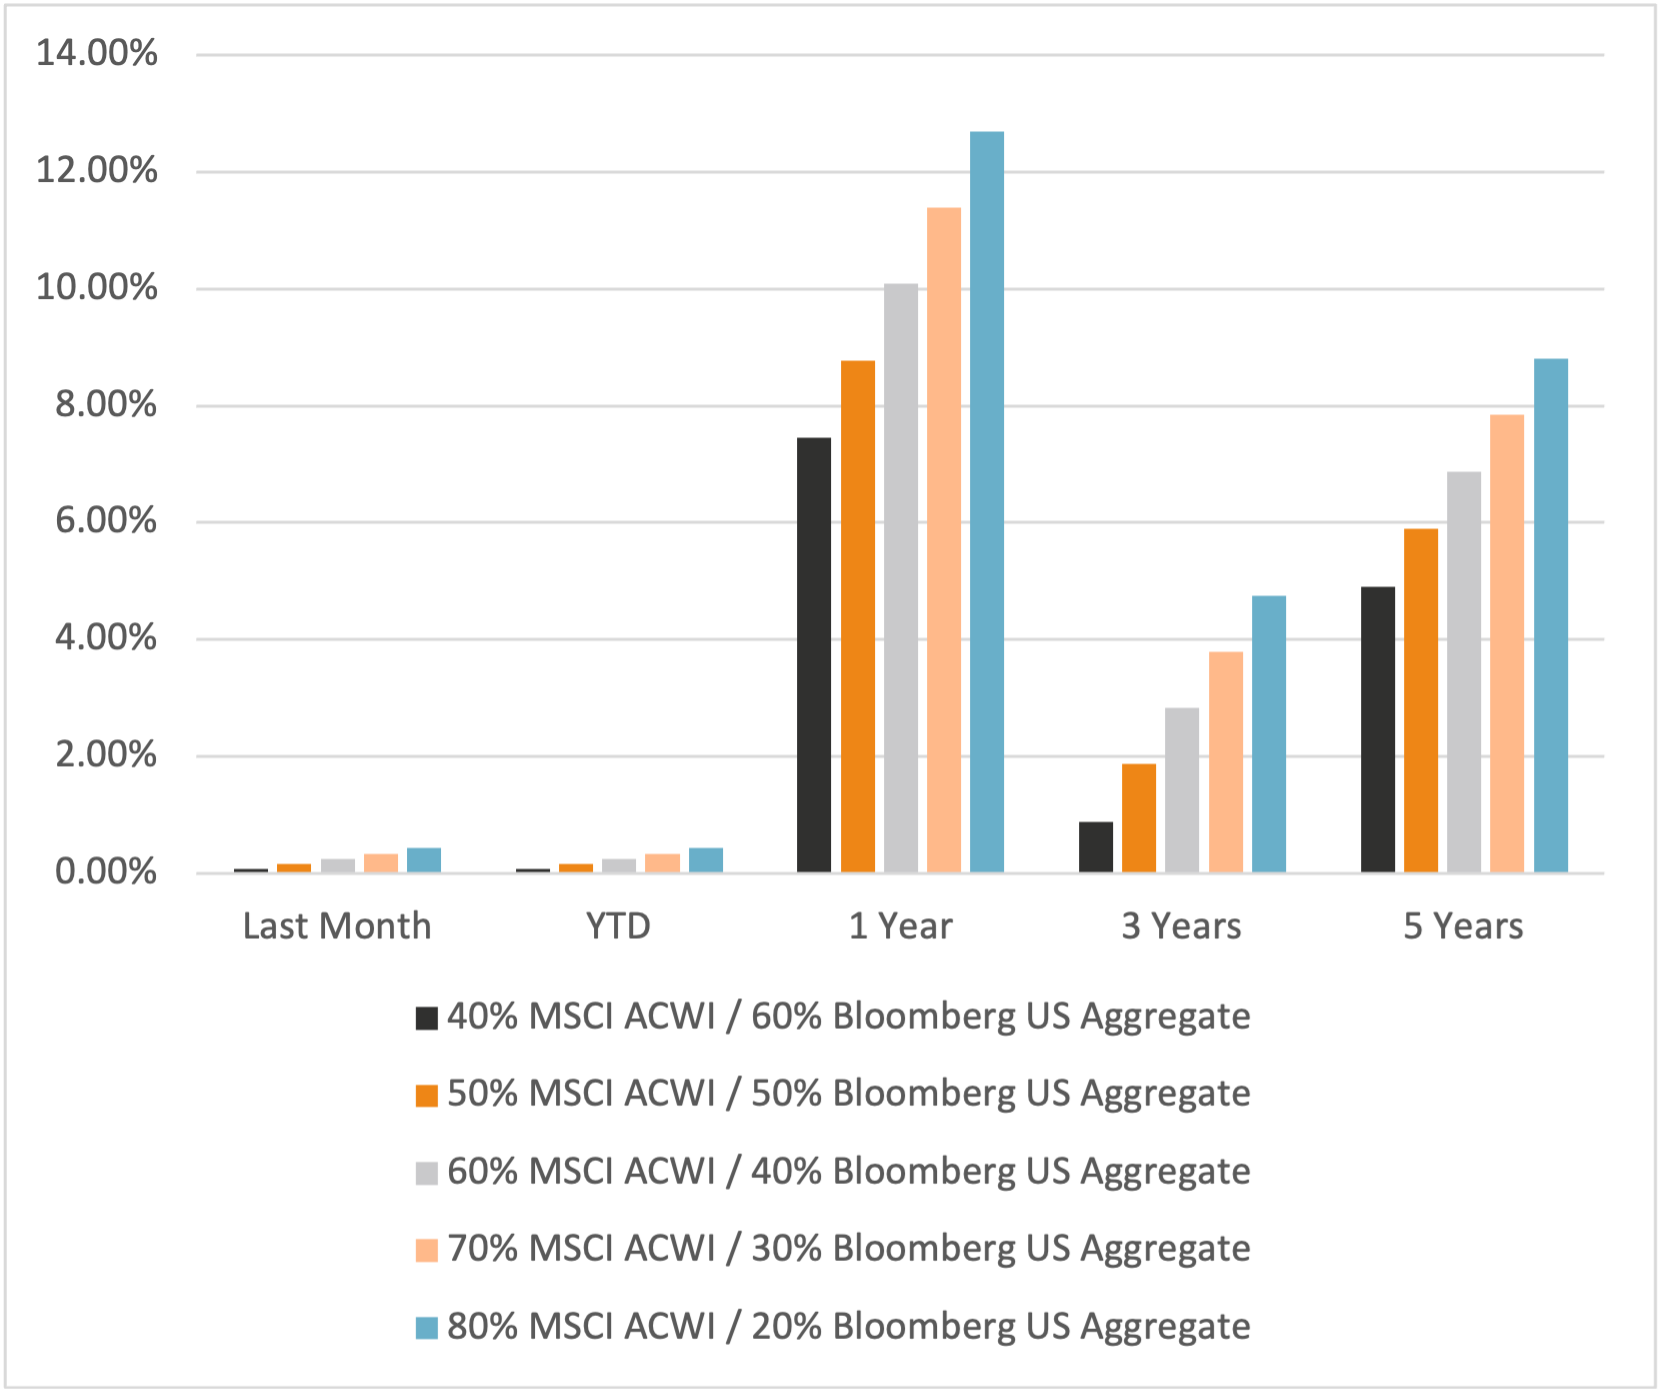
Mix Index Returns
Global Equity / US Taxable Bonds
Indexes are unmanaged and cannot be directly invested into. Past performance is no indication of future results. Investing involves risk and the potential to lose principal.
The Russell 3000 Index is a United States market index that tracks the 3000 largest companies. MSCI Emerging Markets Index is a broad market cap-weighted Index showing the performance of equities across 23 emerging market countries defined as emerging markets by MSCI. MSCI ACWI ex-U.S. Index is a free-float adjusted market capitalization-weighted index that is designed to measure the equity market performance of developed and emerging markets excluding companies based in the United States. Bloomberg U.S. Aggregate Bond Index represents the investment-grade, U.S. dollar-denominated, fixed-rate taxable bond market, including Treasuries, government-related and corporate securities, as well as mortgage and asset-backed securities. Bloomberg Municipal Index is the US Municipal Index that covers the US dollar-denominated long-term tax-exempt bond market. The index has four main sectors: state and local general obligation bonds, revenue bonds, insured bonds, and prerefunded bonds.

July 2024 Market Commentary