Please find our most recent market review below. We hope these perspectives are valuable to you.
– The AdvicePeriod Team
New Bull Market?
The S&P 500 has now gained more than 22% from its October low, marking a new bull market. The U.S. economy continued to grow through the first six months of the year. Bonds moved lower as economic numbers came in a bit better than expected, led by housing. International stocks nearly matched U.S. equities. The Federal Reserve took a pause and hinted at the possibility of one or two more increases before the end of the year.
Key Observations
- The stock market posted a solid performance in June and is up nearly 17% year to date.
- Small-cap and mid-cap stocks outperformed in June, playing catch-up with large tech companies.
- Bonds ended the month moderately lower but are still up 2.1% for the year.
- International developed and emerging markets also underperformed U.S. markets in June but remained positive year to date on an absolute basis.
Market Recap
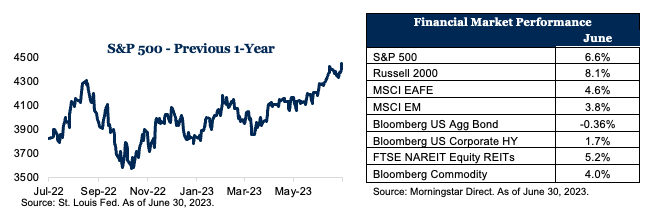
The stock market rallied in June, driven by the consumer discretionary sector, which was up over 11% for the month. The S&P 500 is up nearly 17% year to date, supported by better-than-expected data on the economy, and technology stocks, which are up 42.8% year to date. The Bloomberg U.S. Aggregate Bond Index fell 0.4% for the month while yields moved higher. Yields on the 2-year Treasury have risen, up 56 basis points since the start of the month from 4.34% to 4.90%. The 10-year Treasury yield rose from 3.61% to 3.84%, peaking at 3.87% on June 28. High-yield bonds were up 1.7%, outperforming core bonds. Small- and mid-cap stocks rose 8.1% and 8.3%, respectively, as fears of recession receded. International markets ended the month with solid gains, underperforming the U.S. market as the U.S. dollar fell.
Payrolls jumped 339,000 in May from April. In total, payrolls in March and April were revised up by 93,000. Combined, those numbers were roughly double what experts on Wall Street were expecting. However, the household survey, which includes unincorporated self-employed and workers on unpaid absences, fell sharply from a year earlier, pushing the unemployment rate from 3.4% to 3.7%. Overall wages rose 0.3% in May from April. The rise in the unemployment rate is a modest sign of increased slack in the tight jobs market, but the continued strength in payrolls suggests the economy is still rolling along.
U.S. Inflation Has Been Cut in Half From Last Year’s Peak
Inflation fell in May to around half of last year’s peak. The Consumer Price Index rose 4% last month from a year earlier, according to the Labor Department, well below the peak of 9.1% reached last June and down from April’s 4.9% increase. The Personal Consumption Expenditures Price Index, one of the Fed’s preferred inflation gauges, rose just 0.1% in May. From a year ago, the measure eased to 3.8%, the smallest annual advance in more than two years. Consumer spending also stagnated in May, suggesting the economy’s main engine is starting to lose momentum. Partly in response to the progress on inflation, the Fed agreed to hold interest rates steady after 10 consecutive increases but signaled it was prepared to raise rates next month if the economy and inflation don’t cool more. New economic projections, released by the Fed after its two-day policy meeting, suggested officials were leaning toward slowing down their increases rather than stopping altogether. Most officials estimated two more interest rate increases this year, which would lift rates to a 22-year high and increase their expectations for growth.
It does seem that the end of the Fed’s rate hiking cycle is in sight. Fed officials projected their expectation that the short-term rate they control will be 4.5% to 4.75% at the end of next year, down from the current range of 5% to 5.25%.
Technology Stocks Surge
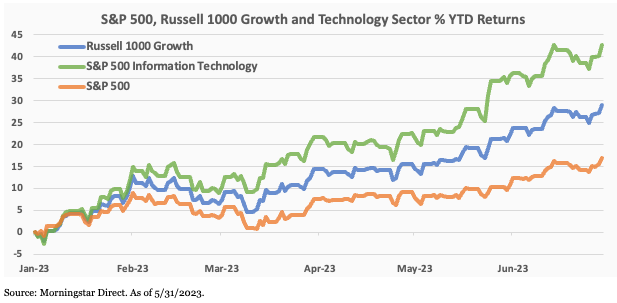
Nearly $5 trillion has been added to the value of the companies in the Nasdaq 100 since the start of the year, with the tech-heavy gauge up almost 40%. The surge in the most influential group in the S&P 500 has helped push the Index up 16% in 2023. Gains have been even more pronounced in the mega cap space, which has soared almost 75% over that time frame. Enthusiasm tied to artificial intelligence (AI) and the anticipation of an end to the Fed’s rate hiking cycle helped drive the gains. The “Big Seven”—including Apple, Microsoft Corp., Alphabet Inc., Amazon.com Inc., Meta Platforms Inc., Nvidia Corp. and Tesla Inc.—boosted profits by 14% a year during the decade through 2022. While their combined earnings slumped more than 20% last year, they’re expected to recover, rising at least 15% in the next two years (according to estimates compiled by Bloomberg). Profits should reach $362 billion in 2024, surpassing the previous peak of $336 billion in 2021.
Outlook
The strong performance of the stock market this year is a reminder of the importance of ignoring short-term predictions. Last year, many experts expressed the view that “inflation is transitory,” then inflation remained sticky. Last fall, most economists seemed to agree that the next recession was “just around the corner,” but the economy continues to grow. Then the consensus view became inflation would stay “higher for longer,” yet now inflation continues to fall. We believe short-term predictions are a shaky foundation on which to build a financial plan. Instead, investors should stay focused on factors they can control, such as the diversification of the portfolio and the quality of the investments they own. Our general advice is to stay invested, stay disciplined, and stay focused on your long-term goals.
Disclosures:
This market commentary is meant for informational and educational purposes only and does not consider any individual personal considerations. As such, the information contained herein is not intended to be personal investment advice or recommendation. Diversification is an investment strategy designed to help manage risk, but it cannot ensure a profit or protect against loss in a declining market. Please consult a financial professional before making any financial-related decisions.
The commentary represents an assessment of the market environment through June 2023. The views and opinions expressed may change based on the market or other conditions. The forward-looking statements are based on certain assumptions, but there can be no assurance that forward-looking statements will materialize. This commentary was written and provided by an unaffiliated third party.
Indexes are unmanaged and cannot be directly invested into. Past performance is no indication of future results. Investing involves risk and the potential to lose principal.
AdvicePeriod is another business name and brand utilized by both Mariner, LLC and Mariner Platform Solutions, LLC, each of which is an SEC registered investment adviser. Registration of an investment adviser does not imply a certain level of skill or training. Each firm is in compliance with the current notice filing requirements imposed upon SEC registered investment advisers by those states in which each firm maintains clients. Each firm may only transact business in those states in which it is notice filed or qualifies for an exemption or exclusion from notice filing requirements. Any subsequent, direct communication by an advisor with a prospective client shall be conducted by a representative that is either registered or qualifies for an exemption or exclusion from registration in the state where the prospective client resides. For additional information about Mariner, LLC or Mariner Platform Solutions, LLC, including fees and services, please contact us utilizing the contact information provided herein or refer to the Investment Adviser Public Disclosure website (www.adviserinfo.sec.gov). Please read the disclosure statement carefully before you invest or send money.
For additional information as to which entity your adviser is registered as an investment adviser representative, please refer to the Investment Adviser Public Disclosure website (www.adviserinfo.sec.gov) or the Form ADV 2B provided to you. Investment adviser representatives of Mariner, LLC dba Mariner Wealth Advisors and dba AdvicePeriod are generally employed by Mariner Wealth Advisors, LLC. Investment adviser representatives of Mariner Platform Solutions, LLC dba AdvicePeriod, are independent contractors.
Index Definitions: The S&P 500 is a capitalization-weighted index designed to measure the performance of the broad domestic economy through changes in the aggregate market value of 500 stocks representing all major industries. Russell 2000 consists of the 2,000 smallest U.S. companies in the Russell 3000 index. MSCI EAFE is an equity index which captures large and mid-cap representation across Developed Markets countries around the world, excluding the U.S. and Canada. The index covers approximately 85% of the free float-adjusted market capitalization in each country. MSCI Emerging Markets captures large and mid-cap representation across Emerging Markets countries. The index covers approximately 85% of the free-float adjusted market capitalization in each country. Bloomberg U.S. Aggregate Index covers the U.S. investment grade fixed rate bond market, with index components for government and corporate securities, mortgage pass-through securities, and asset-backed securities. Bloomberg U.S. Corporate High Yield Index covers the universe of fixed rate, non-investment grade debt. Eurobonds and debt issues from countries designated as emerging markets (sovereign rating of Baa1/BBB+/BBB+ and below using the middle of Moody’s, S&P, and Fitch) are excluded, but Canadian and global bonds (SEC registered) of issuers in non-EMG countries are included. FTSE NAREIT Equity REITs Index contains all Equity REITs not designed as Timber REITs or Infrastructure REITs. Bloomberg Commodity Index is calculated on an excess return basis and reflects commodity futures price movements. The index rebalances annually weighted 2/3 by trading volume, and 1/3 by world production and weight-caps are applied at the commodity, sector, and group level for diversification. Russell 1000® Growth Index measures the performance of the large- cap growth segment of the US equity universe. S&P 500® Information Technology comprises those companies included in the S&P 500 that are classified as members of the GICS® information technology sector.
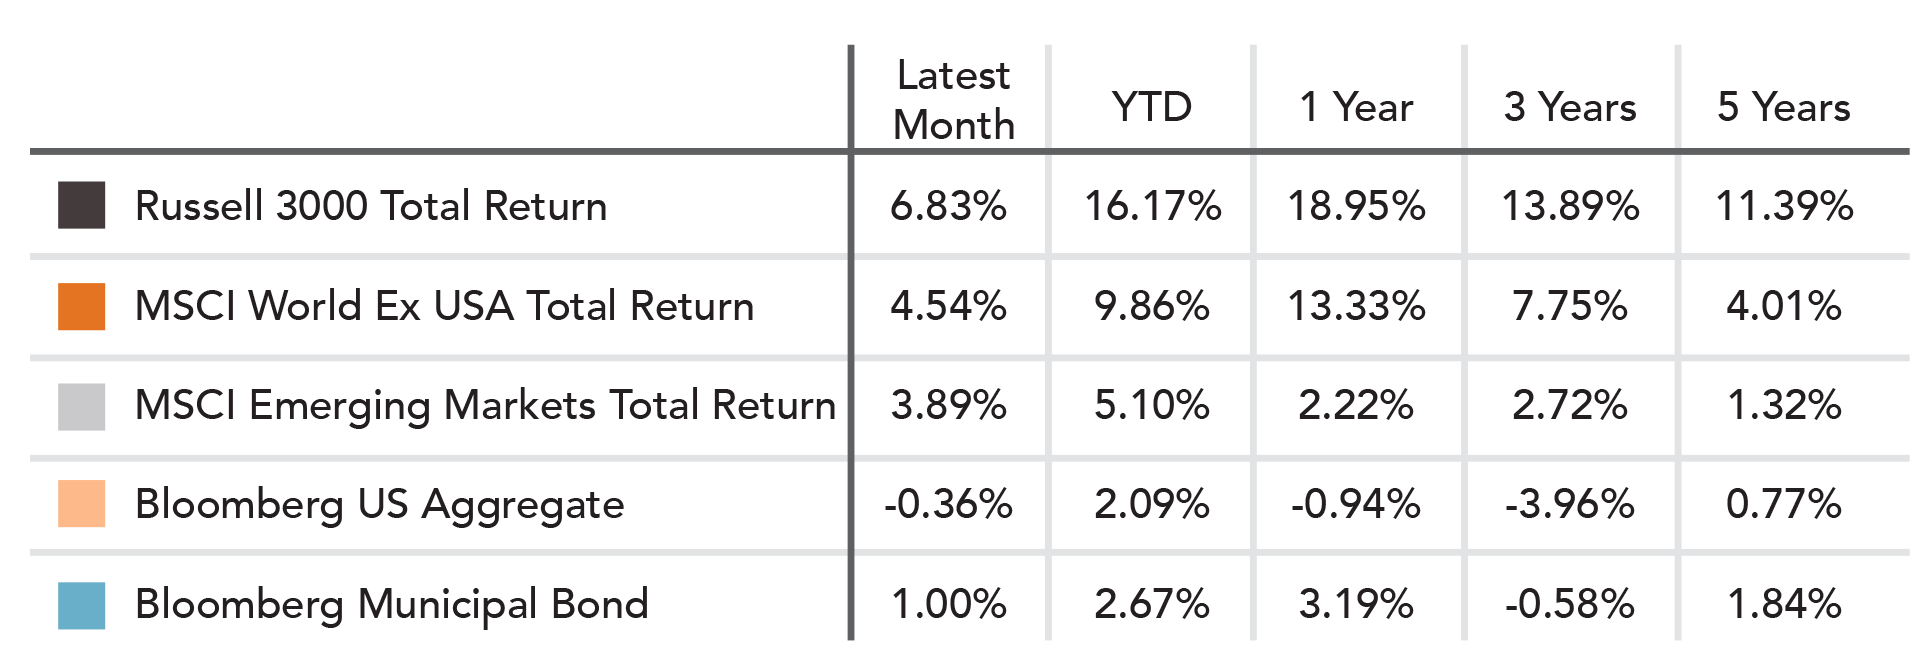
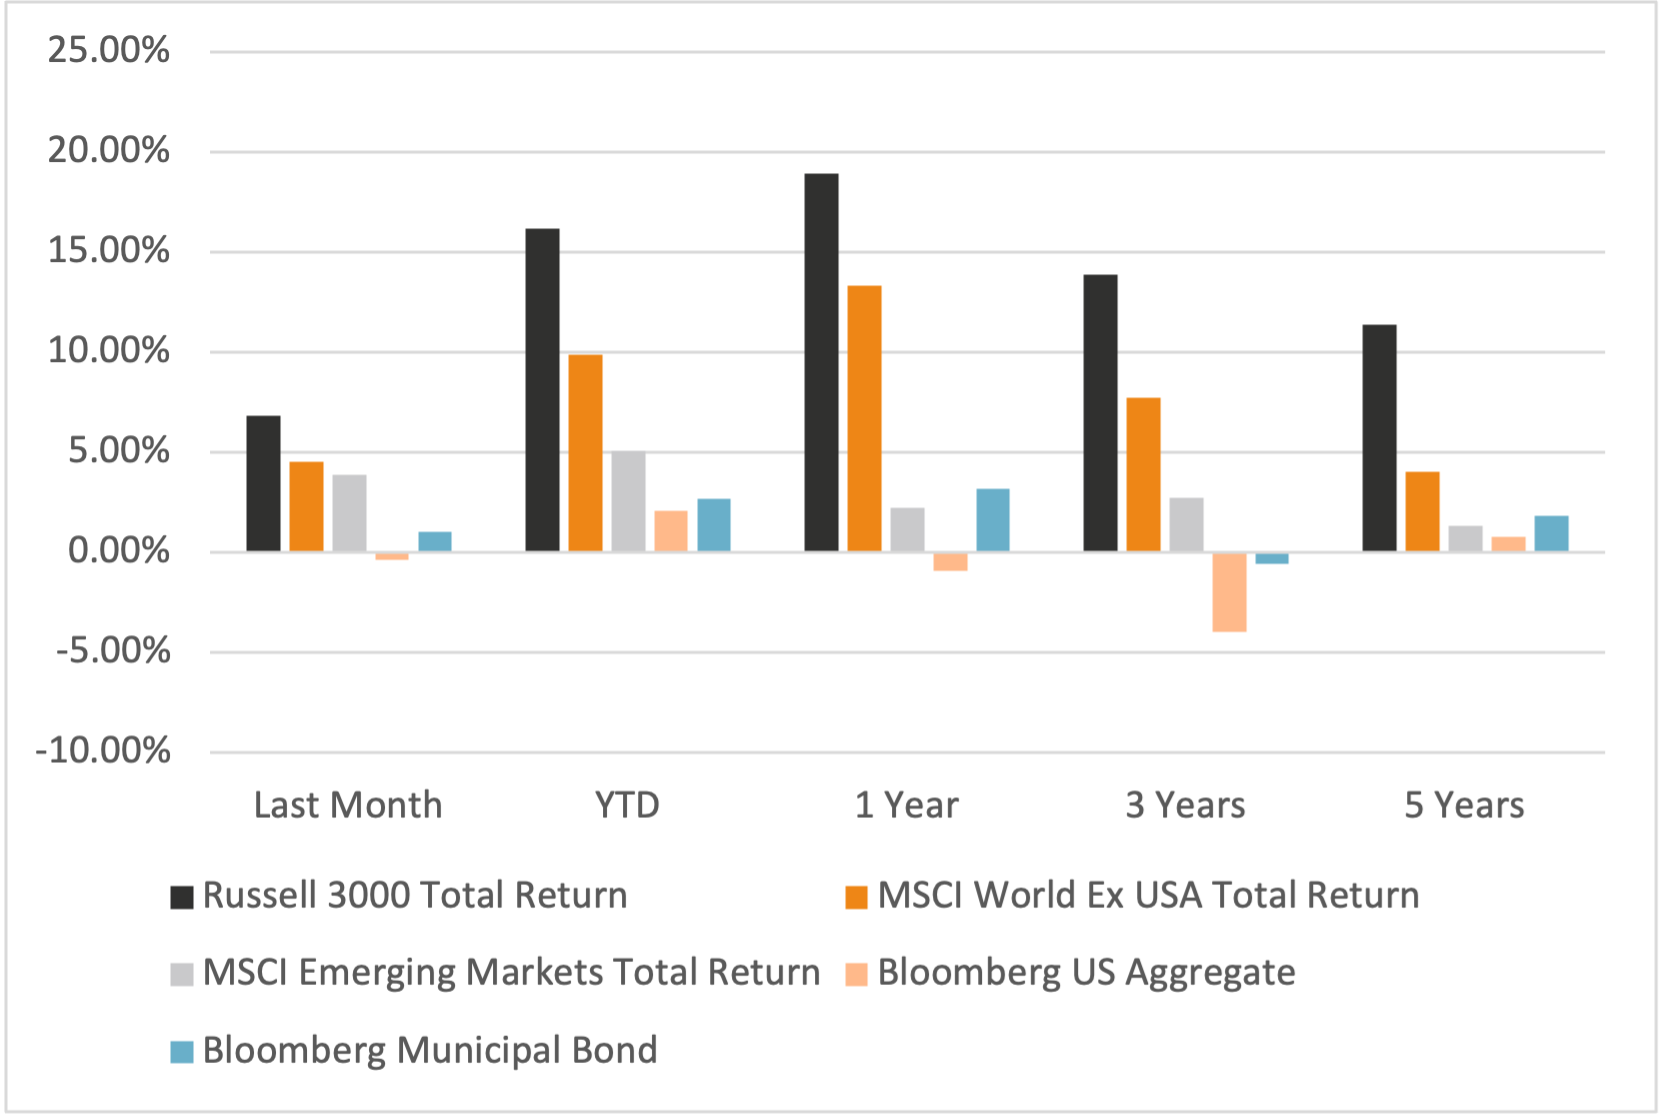
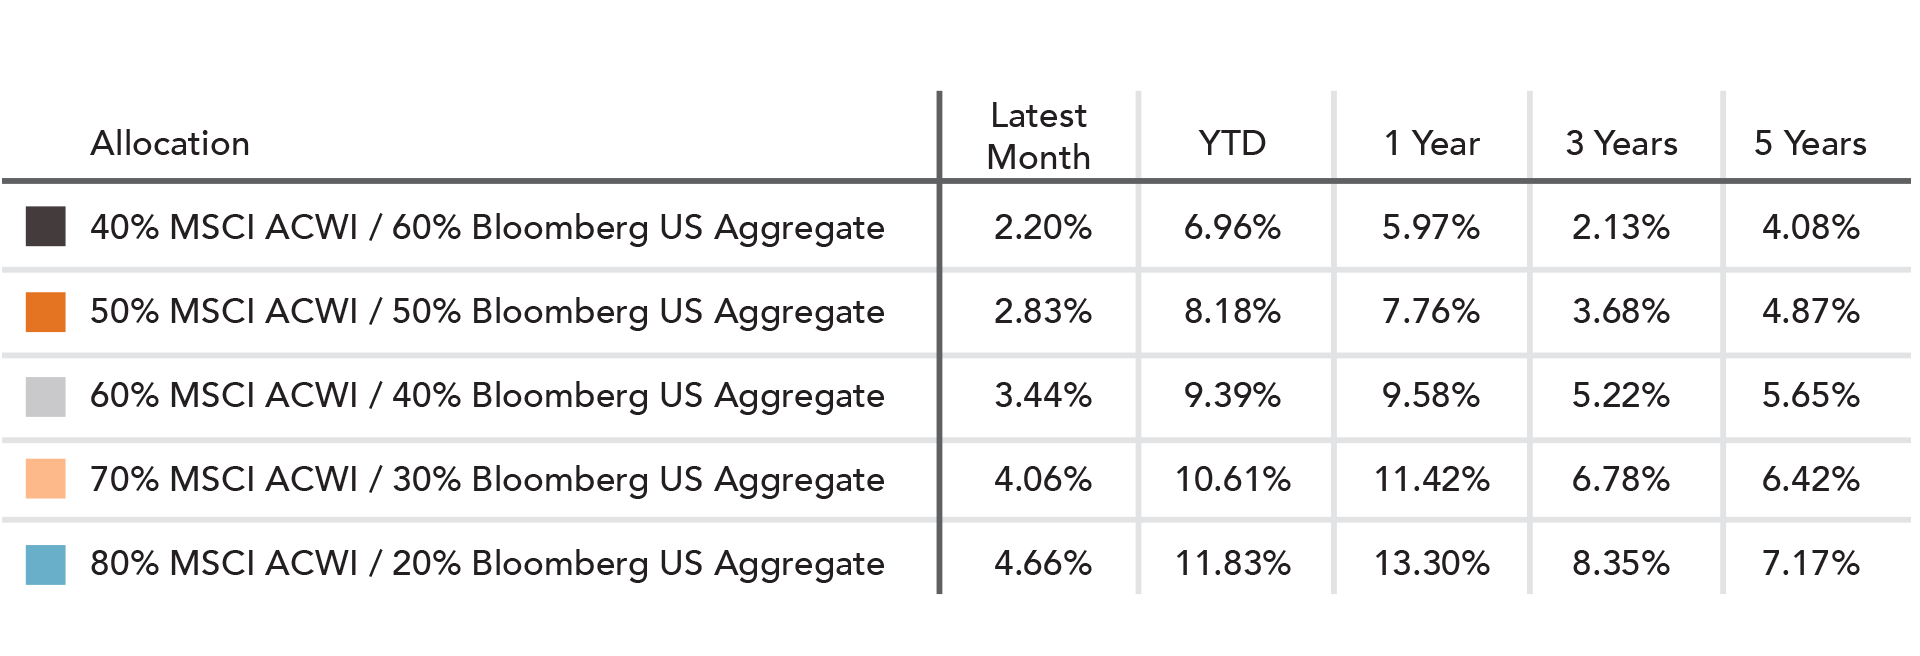
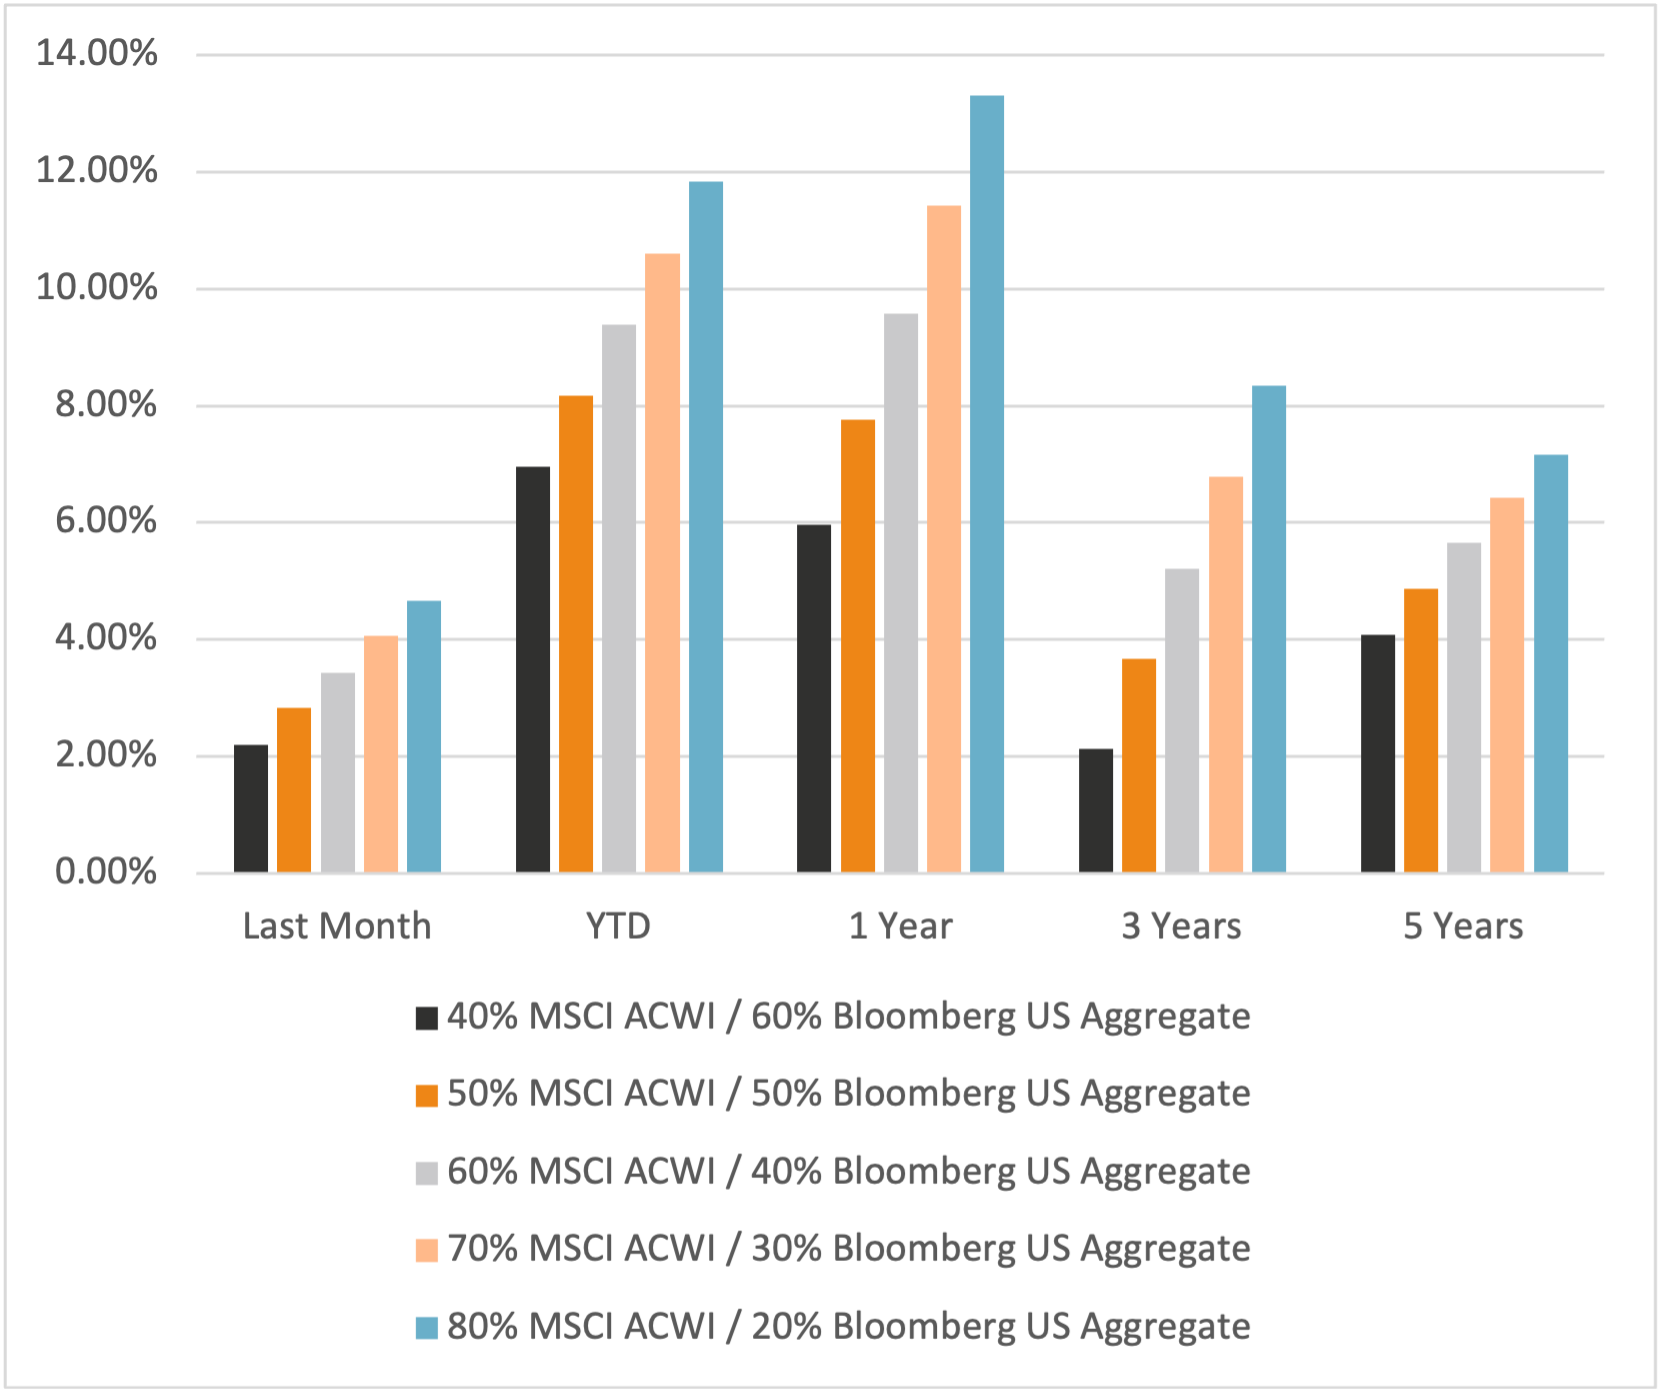
Does past performance matter?
Major Market Index Returns
Period Ending 7/1/2023
Multi-year returns are annualized.
Mix Index Returns
Global Equity / US Taxable Bonds
Indexes are unmanaged and cannot be directly invested into. Past performance is no indication of future results. Investing involves risk and the potential to lose principal.
The Russell 3000 Index is a United States market index that tracks the 3000 largest companies. MSCI Emerging Markets Index is a broad market cap-weighted Index showing the performance of equities across 23 emerging market countries defined as emerging markets by MSCI. MSCI ACWI ex-U.S. Index is a free-float adjusted market capitalization-weighted index that is designed to measure the equity market performance of developed and emerging markets excluding companies based in the United States. Bloomberg U.S. Aggregate Bond Index represents the investment-grade, U.S. dollar-denominated, fixed-rate taxable bond market, including Treasuries, government-related and corporate securities, as well as mortgage and asset-backed securities. Bloomberg Municipal Index is the US Municipal Index that covers the US dollar-denominated long-term tax-exempt bond market. The index has four main sectors: state and local general obligation bonds, revenue bonds, insured bonds, and prerefunded bonds.
April 2024 Market Commentary