Please find our most recent market review below. We hope these perspectives are valuable to you.
– The AdvicePeriod Team
August Slump
Inflation concerns pushed stock prices down in August as 10-year Treasury yields continued their climb. Yields have been driven mostly by the strength of the U.S. economy and the prospect of inflation remaining stubbornly high. International stocks posted losses, led by China. Minutes of the July Federal Reserve policy meeting revealed some Fed officials still see significant risks that inflation might not fall as much as they expect, which could require them to raise rates again this year.
Key Observations
- The S&P 500 lost nearly 2% in August, though the market is up more than 18.7% year to date.
- Small-cap and mid-cap stocks fell 3% to 5% for the month.
- Bonds ended the month down about 0.6%.
- International developed and emerging markets fell ~4% to 6% in August.
Market Recap
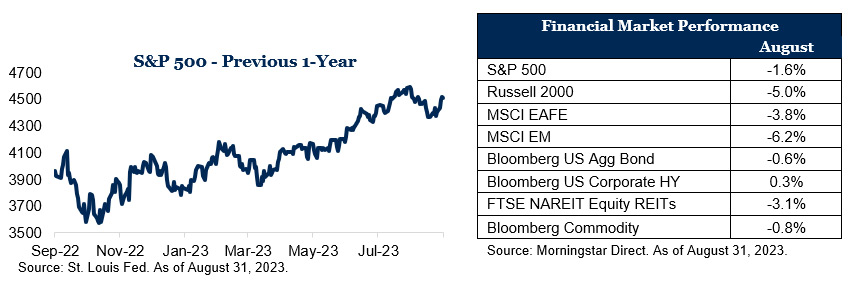
The stock market had a rough month in August as utilities stocks led the stock market lower, down 5.7% (as measured by the MSCI ACWI Utilities Index). The S&P 500 lost about 1.6% during the month, though it is still up over 18.7% year to date, driven primarily by the year-to-date rally in technology stocks. The Bloomberg U.S. Aggregate Bond Index was down about 0.6% for the month, while the 10-year Treasury yield increased. Yields on the 2-year Treasury rose in August, starting at 4.91% and rising to 5.08% on August 25. The 10-year Treasury yield rose from 4.05% to 4.17%. High-yield bonds were up 0.3%, outperforming core bonds. Small- and mid-cap stocks fell 5% and 3.5%, respectively. International markets ended the month with losses as the U.S. dollar rose.
Goldilocks Economy? Not Yet
The U.S. job market showed signs of cooling off in July, but strength in other areas of the economy make it too soon for the Federal Reserve to declare victory in its inflation fight. The Labor Department reported that the economy added a seasonally adjusted 187,000 jobs in July from a month earlier. It also revised the previous two months’ job gains lower. Even so, the unemployment rate, which is based on a separate survey from the job figures, slipped to 3.5% in July from 3.6% in June. That means the pace of job growth is probably still too fast to prevent the unemployment rate from heading lower in the months ahead. And if the unemployment rate falls, it will stoke concerns over wage inflation, which could lead the Fed to continue hiking rates.
Despite worries about the inflation outlook, price pressures continued to cool in July. The Consumer Price Index, a measure of goods and services prices across the economy, rose a mere 0.2% in July, the same as in June, according to the Labor Department. Core prices, which exclude volatile food and energy categories, also increased just 0.2% in both months, extending a broader slowdown in price pressures. The figures led to 3.2% annual inflation in July, up from 3% in June. Annual core inflation ticked down to 4.7% in July from June’s 4.8%. The new numbers lowered the three-month annualized rate of core inflation to 3.1%, the lowest such reading in two years, from 5% in May.
Americans boosted their retail spending last month at the fastest pace since the start of the year as consumers continue to bolster the resilient U.S. economy. Retail sales—a measure of spending at stores, online and in restaurants—rose a seasonally adjusted 0.7% in July from the month prior, according to the Commerce Department. Shoppers spent more at bars and restaurants as well as in back-to-school categories, such as clothing and books, despite the Fed’s efforts to cool the economy by raising interest rates.
The U.S. economy grew at a slower 2.1% pace in the second quarter, revised figures indicated, showing more resilience than expected. Economists had widely believed U.S. growth would falter or even slip into recession in light of sharp increases in interest rates from the Fed. The downward revision in gross domestic product from 2.4% reflected somewhat softer business investment and inventory production than originally reported. Adjusted pretax profit slipped at a 0.4% annual rate and has fallen 6.5% in the past year.
Inflation Continues to Fall
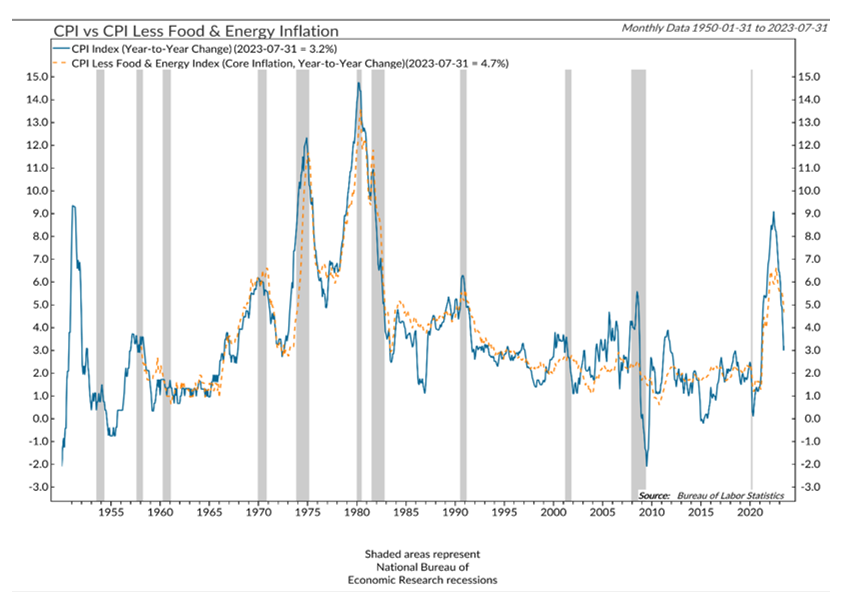
Source: Ned Davis Research. As of August 28, 2023.
Inflation continued to decline last month as the three-month annualized rate of core inflation dropped to 3.1%, the lowest such reading in two years, from 5% in May. The biggest contributor to headline and core CPI monthly price growth was shelter, which rose 0.4%, accounting for over 90% of the total increase. Rent rose 0.4%, the least since December 2021. Excluding shelter, core CPI fell 0.1%, its first decline since January 2021. Falling inflation has been a big contributor to the rally in stocks this year, as it suggests the Fed may be nearing the end of its tightening cycle.
Outlook
The U.S. economy has been surprisingly resilient this year, mostly shrugging off 525 basis points of Fed rate hikes since March of last year. While activity in the most interest rate-sensitive sectors, like housing and manufacturing, has declined, the unemployment rate is still near historic lows and CPI inflation is a third of what it was at its cyclical peak last year. The Fed seems on track for pulling off the hat trick of normalizing interest rates and slowing inflation while not sending the economy into recession. A soft landing seems more likely today than it did just a few short months ago. Though risks remain, our advice to investors remains the same: Stay disciplined, stick to the plan and stay focused on long-term goals.
Disclosures:
This market commentary is meant for informational and educational purposes only and does not consider any individual personal considerations. As such, the information contained herein is not intended to be personal investment advice or recommendation. References to specific companies, asset classes, and financial markets are for illustrative purposes only. Diversification is an investment strategy designed to help manage risk but cannot ensure a profit or protect against loss in a declining market. Please consult a financial professional before making any financial-related decisions.
The commentary represents an assessment of the market environment through August 2023. The views and opinions expressed may change based on the market or other conditions. The forward-looking statements are based on certain assumptions, but there can be no assurance that forward-looking statements will materialize. This commentary was written and provided by an unaffiliated third party; we cannot guarantee the accuracy or completeness of any statements or data contained herein.
Indexes are unmanaged and cannot be directly invested into. Past performance is no indication of future results. Investing involves risk and the potential to lose principal.
AdvicePeriod is another business name and brand utilized by both Mariner, LLC and Mariner Platform Solutions, LLC, each of which is an SEC registered investment adviser. Registration of an investment adviser does not imply a certain level of skill or training. Each firm is in compliance with the current notice filing requirements imposed upon SEC registered investment advisers by those states in which each firm maintains clients. Each firm may only transact business in those states in which it is notice filed or qualifies for an exemption or exclusion from notice filing requirements. Any subsequent, direct communication by an advisor with a prospective client shall be conducted by a representative that is either registered or qualifies for an exemption or exclusion from registration in the state where the prospective client resides. For additional information about Mariner, LLC or Mariner Platform Solutions, LLC, including fees and services, please contact us utilizing the contact information provided herein or refer to the Investment Adviser Public Disclosure website (www.adviserinfo.sec.gov). Please read the disclosure statement carefully before you invest or send money.
For additional information as to which entity your adviser is registered as an investment adviser representative, please refer to the Investment Adviser Public Disclosure website (www.adviserinfo.sec.gov) or the Form ADV 2B provided to you. Investment adviser representatives of Mariner, LLC dba Mariner Wealth Advisors and dba AdvicePeriod are generally employed by Mariner Wealth Advisors, LLC. Investment adviser representatives of Mariner Platform Solutions, LLC dba AdvicePeriod, are independent contractors.
Index Definitions: The S&P 500 is a capitalization-weighted index designed to measure the performance of the broad domestic economy through changes in the aggregate market value of 500 stocks representing all major industries. Russell 2000 consists of the 2,000 smallest U.S. companies in the Russell 3000 index. MSCI EAFE is an equity index which captures large and mid-cap representation across Developed Markets countries around the world, excluding the U.S. and Canada. The index covers approximately 85% of the free float-adjusted market capitalization in each country. MSCI Emerging Markets captures large and mid-cap representation across Emerging Markets countries. The index covers approximately 85% of the free-float adjusted market capitalization in each country. Bloomberg U.S. Aggregate Index covers the U.S. investment grade fixed rate bond market, with index components for government and corporate securities, mortgage pass-through securities, and asset-backed securities. Bloomberg U.S. Corporate High Yield Index covers the universe of fixed rate, non-investment grade debt. Eurobonds and debt issues from countries designated as emerging markets (sovereign rating of Baa1/BBB+/BBB+ and below using the middle of Moody’s, S&P, and Fitch) are excluded, but Canadian and global bonds (SEC registered) of issuers in non-EMG countries are included. FTSE NAREIT Equity REITs Index contains all Equity REITs not designed as Timber REITs or Infrastructure REITs. Bloomberg Commodity Index is calculated on an excess return basis and reflects commodity futures price movements. The index rebalances annually weighted 2/3 by trading volume, and 1/3 by world production and weight-caps are applied at the commodity, sector, and group level for diversification. MSCI ACWI Utilities Index captures large and mid cap representation across 23 Developed Markets (DM) and 24 Emerging Markets (EM) countries.
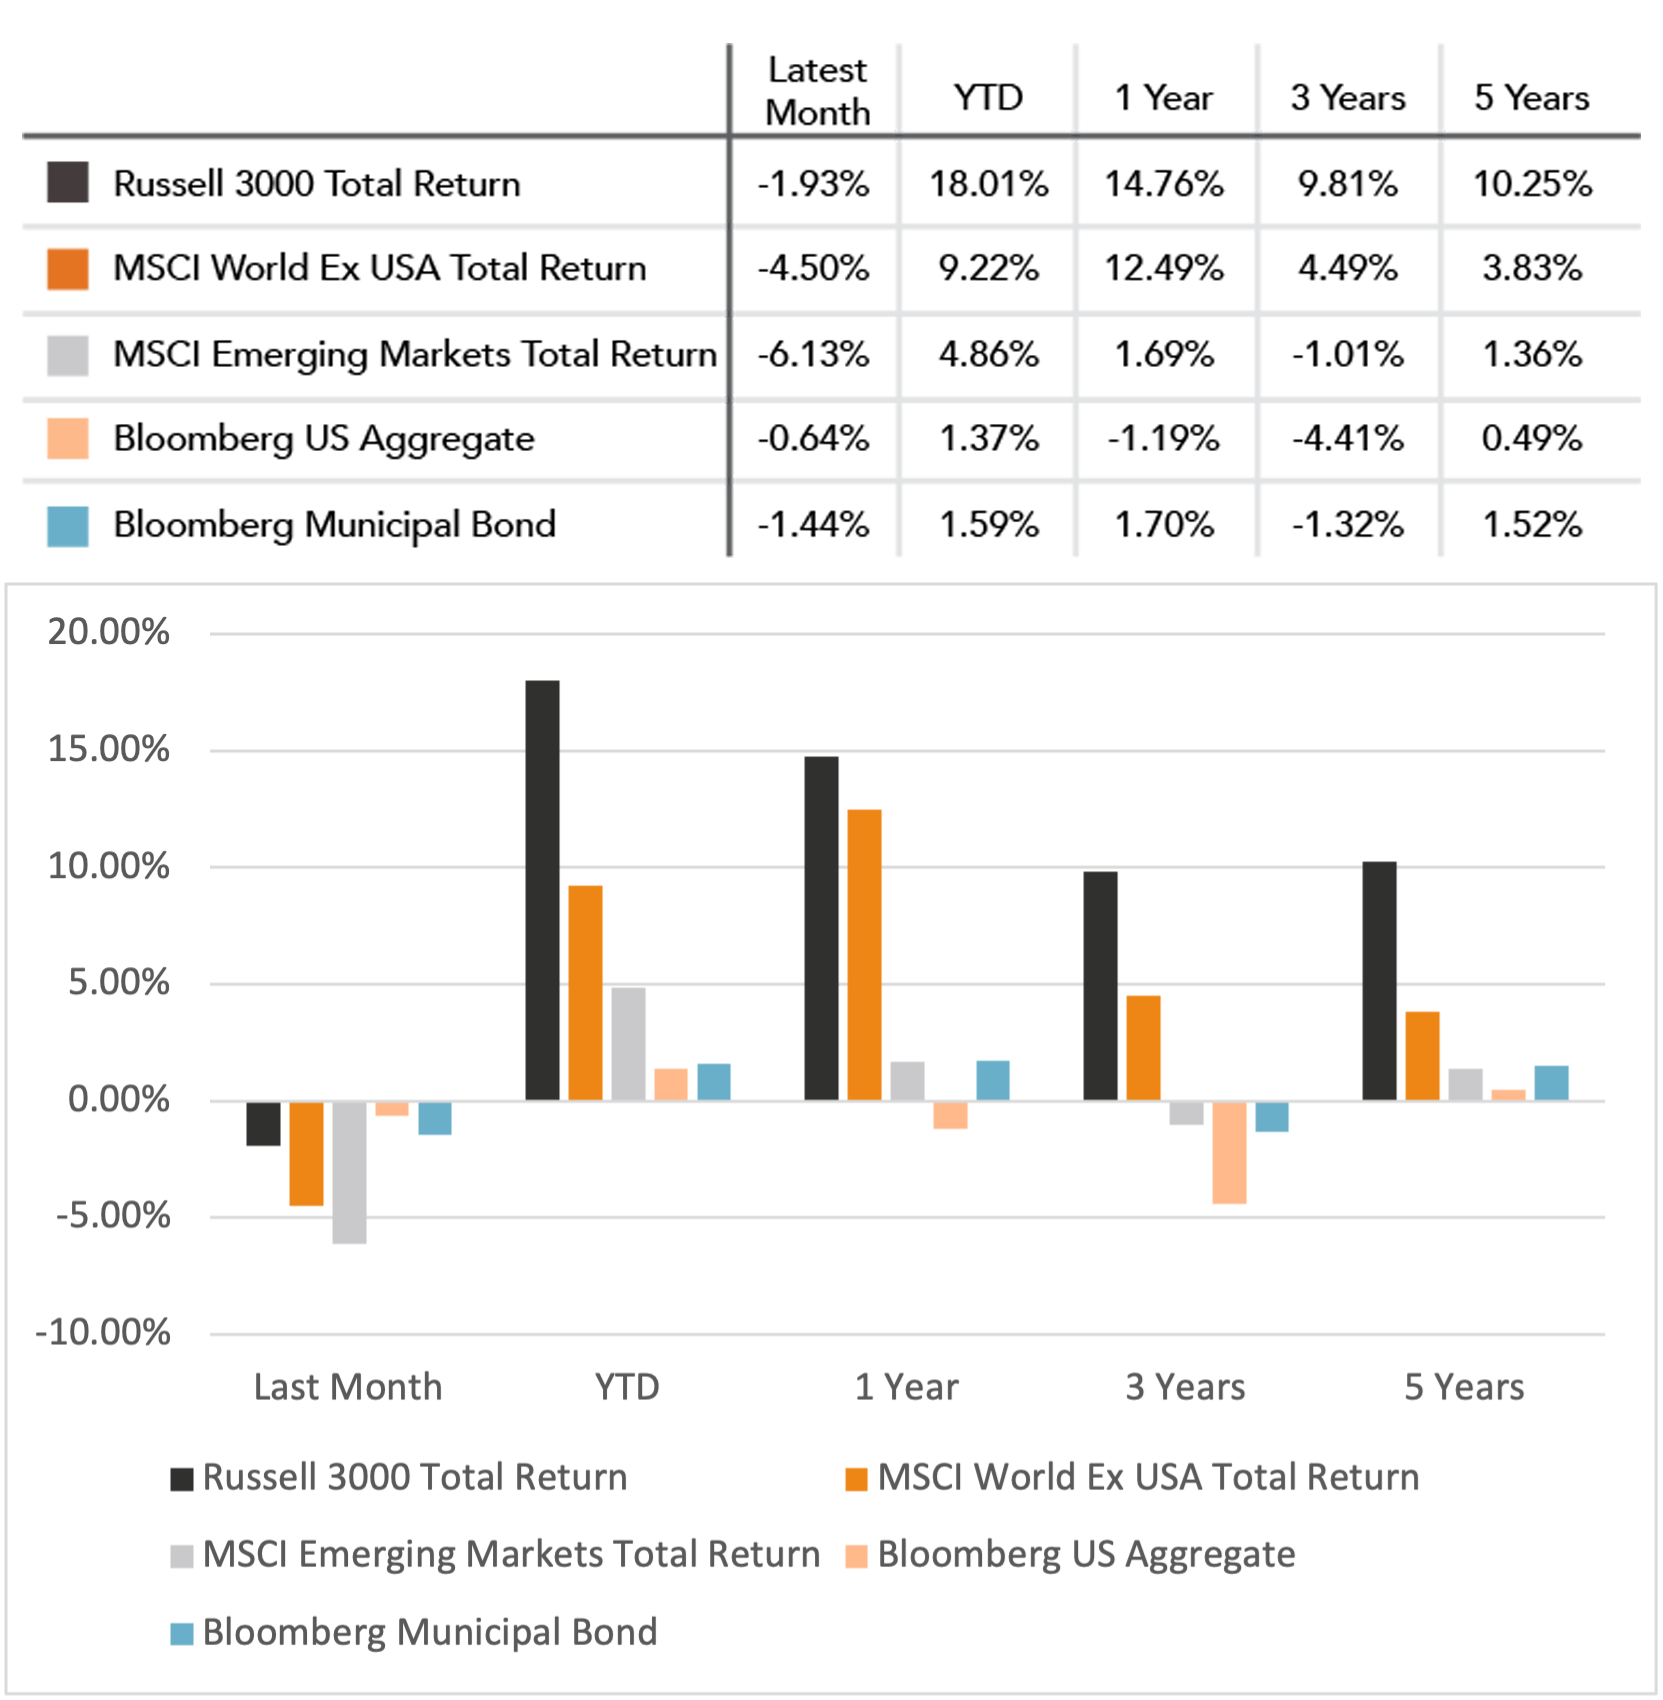
Does past performance matter?
Major Market Index Returns
Period Ending 9/1/2023
Multi-year returns are annualized.
Mix Index Returns
Global Equity / US Taxable Bonds
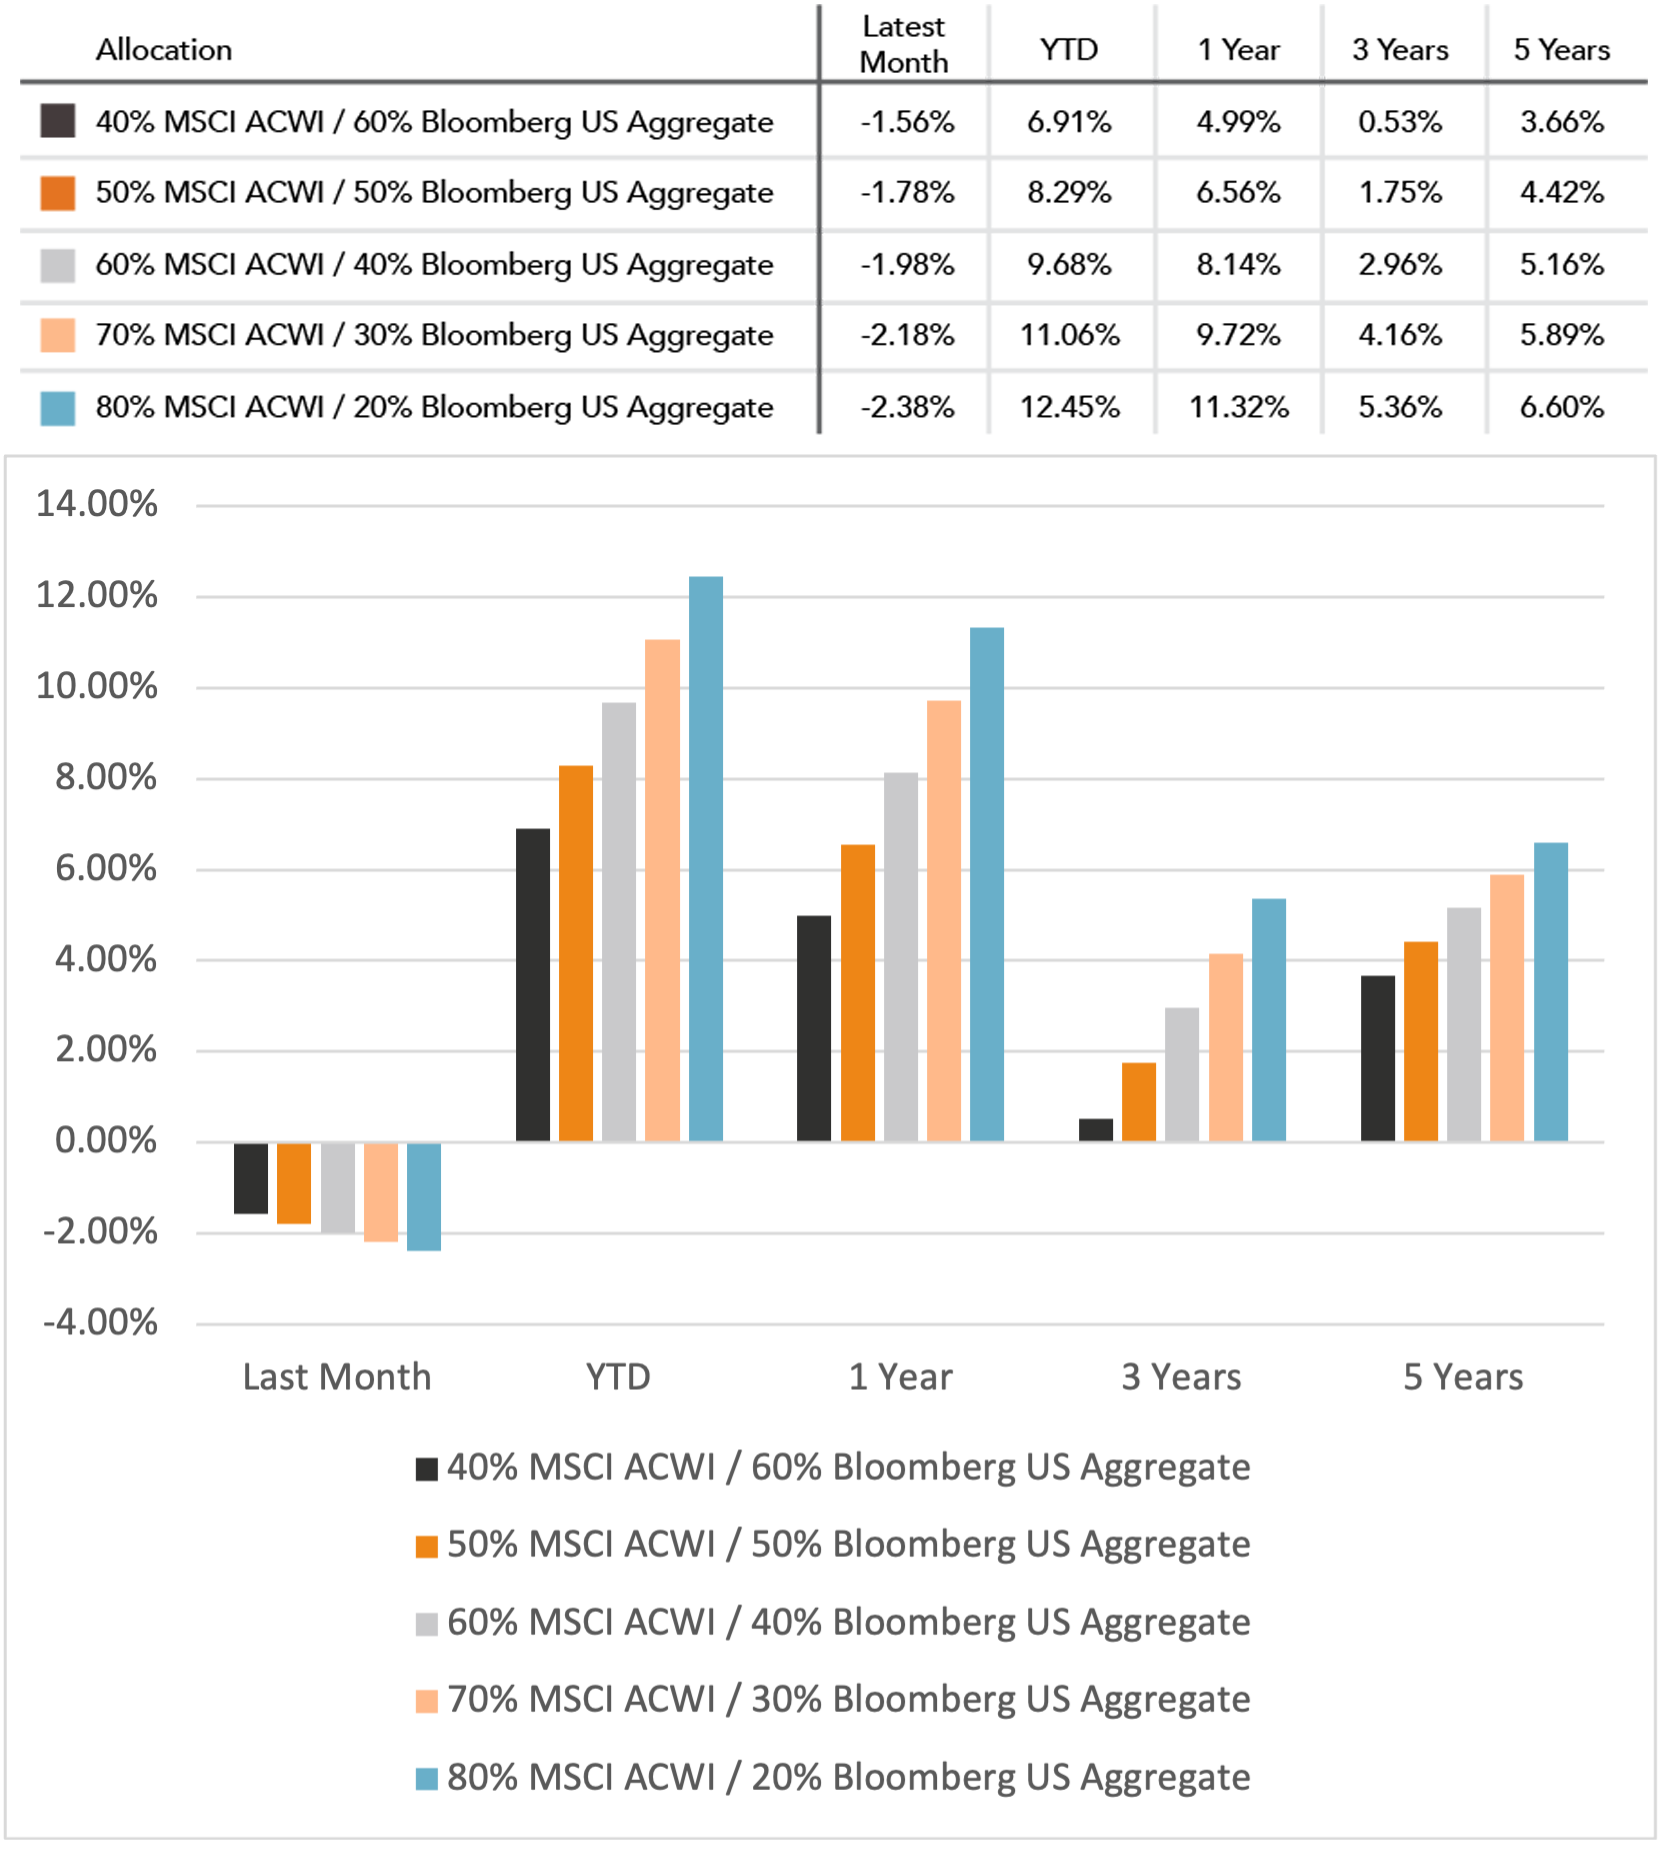
Indexes are unmanaged and cannot be directly invested into. Past performance is no indication of future results. Investing involves risk and the potential to lose principal.
The Russell 3000 Index is a United States market index that tracks the 3000 largest companies. MSCI Emerging Markets Index is a broad market cap-weighted Index showing the performance of equities across 23 emerging market countries defined as emerging markets by MSCI. MSCI ACWI ex-U.S. Index is a free-float adjusted market capitalization-weighted index that is designed to measure the equity market performance of developed and emerging markets excluding companies based in the United States. Bloomberg U.S. Aggregate Bond Index represents the investment-grade, U.S. dollar-denominated, fixed-rate taxable bond market, including Treasuries, government-related and corporate securities, as well as mortgage and asset-backed securities. Bloomberg Municipal Index is the US Municipal Index that covers the US dollar-denominated long-term tax-exempt bond market. The index has four main sectors: state and local general obligation bonds, revenue bonds, insured bonds, and prerefunded bonds.
April 2024 Market Commentary