Please find our most recent market review below. We hope these perspectives are valuable to you.
– The AdvicePeriod Team
Market Update: April 2025 In Review
Key Observations
- U.S. stock markets were highly volatile in April. The S&P 500 and Dow posted their third consecutive monthly losses, while the Nasdaq eked out a small gain thanks to strong tech earnings. Fueled by new tariffs and uncertainty over trade policy, investor anxiety caused sharp swings and a brief bear market.
- The U.S. economy unexpectedly contracted by 0.3% in Q1 2025, largely due to a 41% surge in imports, as businesses and consumers rushed to buy goods before tariffs took effect. This temporary spike in imports masked otherwise modest growth and may reverse in coming quarters.
- Inflation forecasts rose, with the Consumer Price Index (CPI) now expected to climb 3.5% in 2025 as tariffs push up prices for everyday goods. Consumer confidence dropped sharply and job growth slowed, signaling growing pressure on households and the labor market.
April was marked by significant volatility and important shifts in economic data, reflecting the complex environment investors are navigating. Below, we highlight three major themes that shaped the market landscape this month.
Market Recap
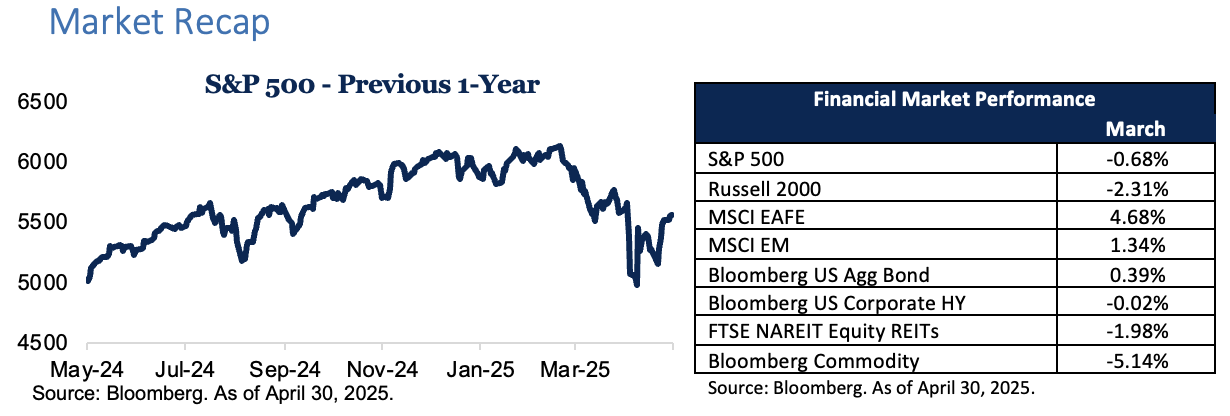 Market Volatility Amid Trade Uncertainty
April was a turbulent month for global and U.S. equities, with volatility driven largely by uncertainty surrounding new U.S. trade tariffs and their potential economic impact. The S&P 500 and Dow Jones Industrial Average both posted their third consecutive monthly declines, ending the month down 0.68% and 3.08%, respectively. The Nasdaq Composite, however, managed a 0.88% gain for the month, buoyed by strong earnings reports from several major technology companies in the final week of April.
Throughout the month, headlines concerning the implementation of sweeping new tariffs on a broad range of imported goods shaped investor sentiment. These tariff measures, announced in early April, contributed to sharp swings in equity prices as investors assessed the likely effects on corporate earnings, supply chains and consumer prices. At one point, the S&P 500 briefly entered bear market territory, falling more than 20% from its February peak, before rebounding in the final days of the month with a rally in technology stocks.
This period of heightened volatility reflects the market’s ongoing sensitivity to policy developments and macroeconomic data. While the late-month recovery in technology stocks provided some relief, the broader market remains cautious; investors are waiting for further clarity on the trajectory of trade policy and its impact on the economy.
Economic Contraction from Import Surge
The latest data on U.S. economic growth surprised many analysts, with the Bureau of Economic Analysis reporting that real GDP contracted at an annualized rate of 0.3% in the first quarter of 2025. This marked the first quarterly contraction since the brief pandemic-driven downturn in 2020 and stands in contrast to consensus forecasts that anticipated modest growth.
The primary driver of this contraction was a dramatic 41% surge in imports, as businesses and consumers accelerated purchases of goods ahead of the anticipated tariff increases. This front-loading of imports subtracted more than five percentage points from GDP growth, outweighing the modest gains in exports and consumer spending. Economists note that this phenomenon is likely to be temporary, as the spike in imports is expected to reverse in subsequent quarters once the new tariffs are fully in effect.
Despite the concerning headline GDP number, it’s important to recognize that the contraction was driven by a unique set of circumstances rather than a broad-based slowdown in underlying economic activity. Nonetheless, the data underscores the significant impact that trade policy decisions can have on short-term economic performance, and also highlight the importance of monitoring future trends in trade and inventory management.
Rising Inflation and Consumer Strain
Inflationary pressures intensified in April, with both headline and core measures of consumer prices moving higher. The CPI is now forecast to rise 3.5% in 2025, while core CPI (which excludes food and energy) is expected to increase by 3.9%. The new tariffs have contributed to higher prices for a wide range of consumer goods, particularly apparel, electronics and household items. Analysts estimate that the average U.S. household could face several thousand dollars in additional costs over the course of the year due to these policy changes.
Recent surveys of consumer sentiment reflect the impact of rising prices on consumers. The University of Michigan’s Consumer Sentiment Index dropped sharply in April, reaching its lowest level since 2020. Respondents cited concerns about inflation, higher borrowing costs and uncertainty about future economic conditions as key factors weighing on their outlook.
The labor market, while still showing signs of resilience, has also begun to soften. Private payroll growth slowed to its lowest pace in over two years. The unemployment rate ticked higher as businesses adjusted to higher input costs and a more cautious consumer environment. While the job market remains relatively healthy by historical standards, these trends suggest that the economy is entering a more challenging phase, as both households and businesses face increased pressure.
Looking Ahead
The developments last month highlight the dynamic and interconnected nature of today’s global economy. The interplay between trade policy, inflation and consumer behavior is creating a complex environment for investors and policymakers alike. While recent market volatility and the first-quarter GDP contraction have raised concerns, it’s important to recognize the unique factors at play and to maintain a long-term perspective.
As always, our team is closely monitoring these trends and will continue to provide you with timely updates and insights.
Disclosures:
This market commentary is meant for informational and educational purposes only and does not consider any individual personal considerations. As such, the information contained herein is not intended to be personal investment advice or a recommendation of any kind. The commentary represents an assessment of the market environment through April 2025.
The views and opinions expressed may change based on the market or other conditions. The forward-looking statements are based on certain assumptions, but there can be no assurance that forward-looking statements will materialize.
Equity securities are subject to price fluctuation and investments made in small and mid-cap companies generally involve a higher degree of risk and volatility than investments in large-cap companies. International securities are generally subject to increased risks, including currency fluctuations and social, economic, and political uncertainties, which could increase volatility. These risks are magnified in emerging markets.
Fixed-income securities are subject to loss of principal during periods of rising interest rates and are subject to various other risks including changes in credit quality, market valuations, liquidity, prepayments, early redemption, corporate events, tax ramifications, and other factors before investing. Interest rates and bond prices tend to move in opposite directions. When interest rates fall, bond prices typically rise, and conversely, when interest rates rise, bond prices typically fall.
There is no assurance that any investment, plan, or strategy will be successful. Investing involves risk, including the possible loss of principal. Past performance does not guarantee future results, and nothing herein should be interpreted as an indication of future performance. Please consult your financial professional before making any investment or financial decisions.
AdvicePeriod is another business name and brand utilized by both Mariner, LLC and Mariner Platform Solutions, LLC, each of which is an SEC registered investment adviser. Registration of an investment adviser does not imply a certain level of skill or training. For additional information about Mariner, LLC or Mariner Platform Solutions, LLC, including fees and services, please contact us utilizing the contact information provided herein or refer to the Investment Adviser Public Disclosure website (www.adviserinfo.sec.gov).
For additional information as to which entity your adviser is registered as an investment adviser representative, please refer to the Investment Adviser Public Disclosure website (www.adviserinfo.sec.gov) or the Form ADV 2B provided to you. Investment adviser representatives of Mariner, LLC are generally employees. Investment adviser representatives of Mariner Platform Solutions, LLC dba AdvicePeriod, are independent contractors.
Indexes are unmanaged and cannot be directly invested into. Index Definitions: The S&P 500 is a capitalization-weighted index designed to measure the performance of the broad domestic economy through changes in the aggregate market value of 500 stocks representing all major industries. Russell 2000 consists of the 2,000 smallest U.S. companies in the Russell 3000 index. MSCI EAFE is an equity index which captures large and mid-cap representation across Developed Markets countries around the world, excluding the U.S. and Canada. The index covers approximately 85% of the free float-adjusted market capitalization in each country. MSCI Emerging Markets captures large and mid-cap representation across Emerging Markets countries. The index covers approximately 85% of the free-float adjusted market capitalization in each country. Bloomberg U.S. Aggregate Index covers the U.S. investment grade fixed rate bond market, with index components for government and corporate securities, mortgage pass-through securities, and asset-backed securities. Bloomberg U.S. Corporate High Yield Index covers the universe of fixed rate, non-investment grade debt. Eurobonds and debt issues from countries designated as emerging markets (sovereign rating of Baa1/BBB+/BBB+ and below using the middle of Moody’s, S&P, and Fitch) are excluded, but Canadian and global bonds (SEC registered) of issuers in non-EMG countries are included. FTSE NAREIT Equity REITs Index contains all Equity REITs not designed as Timber REITs or Infrastructure REITs. Bloomberg Commodity Index is calculated on an excess return basis and reflects commodity futures price movements. The index rebalances annually weighted 2/3 by trading volume, and 1/3 by world production and weight-caps are applied at the commodity, sector, and group level for diversification. The Nasdaq Composite is a stock market index that includes almost all stocks listed on the Nasdaq stock exchange. The Dow Jones Industrial Average is a stock market index of 30 prominent companies listed on stock exchanges in the United States.
Does past performance matter?
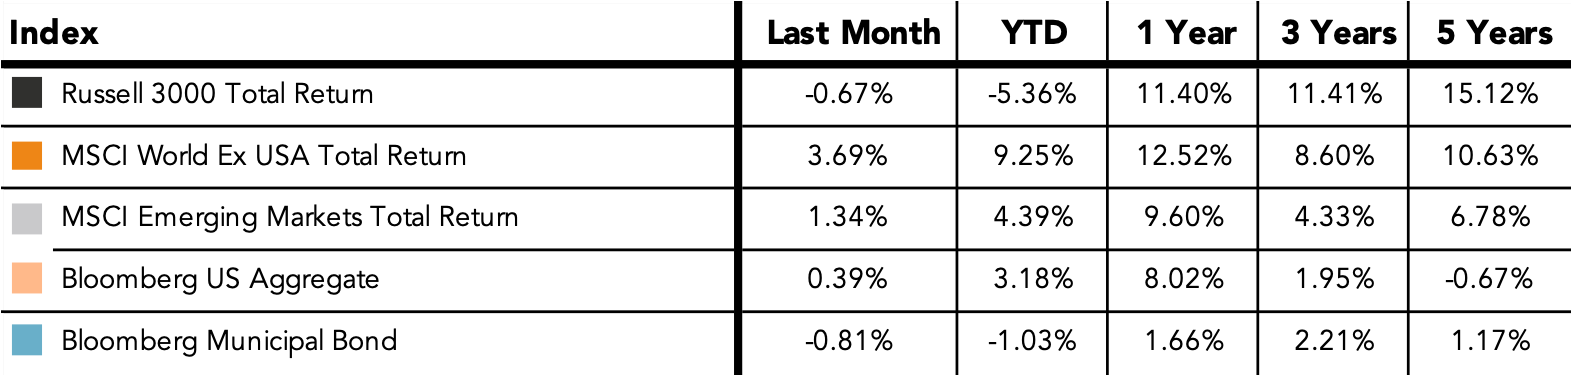
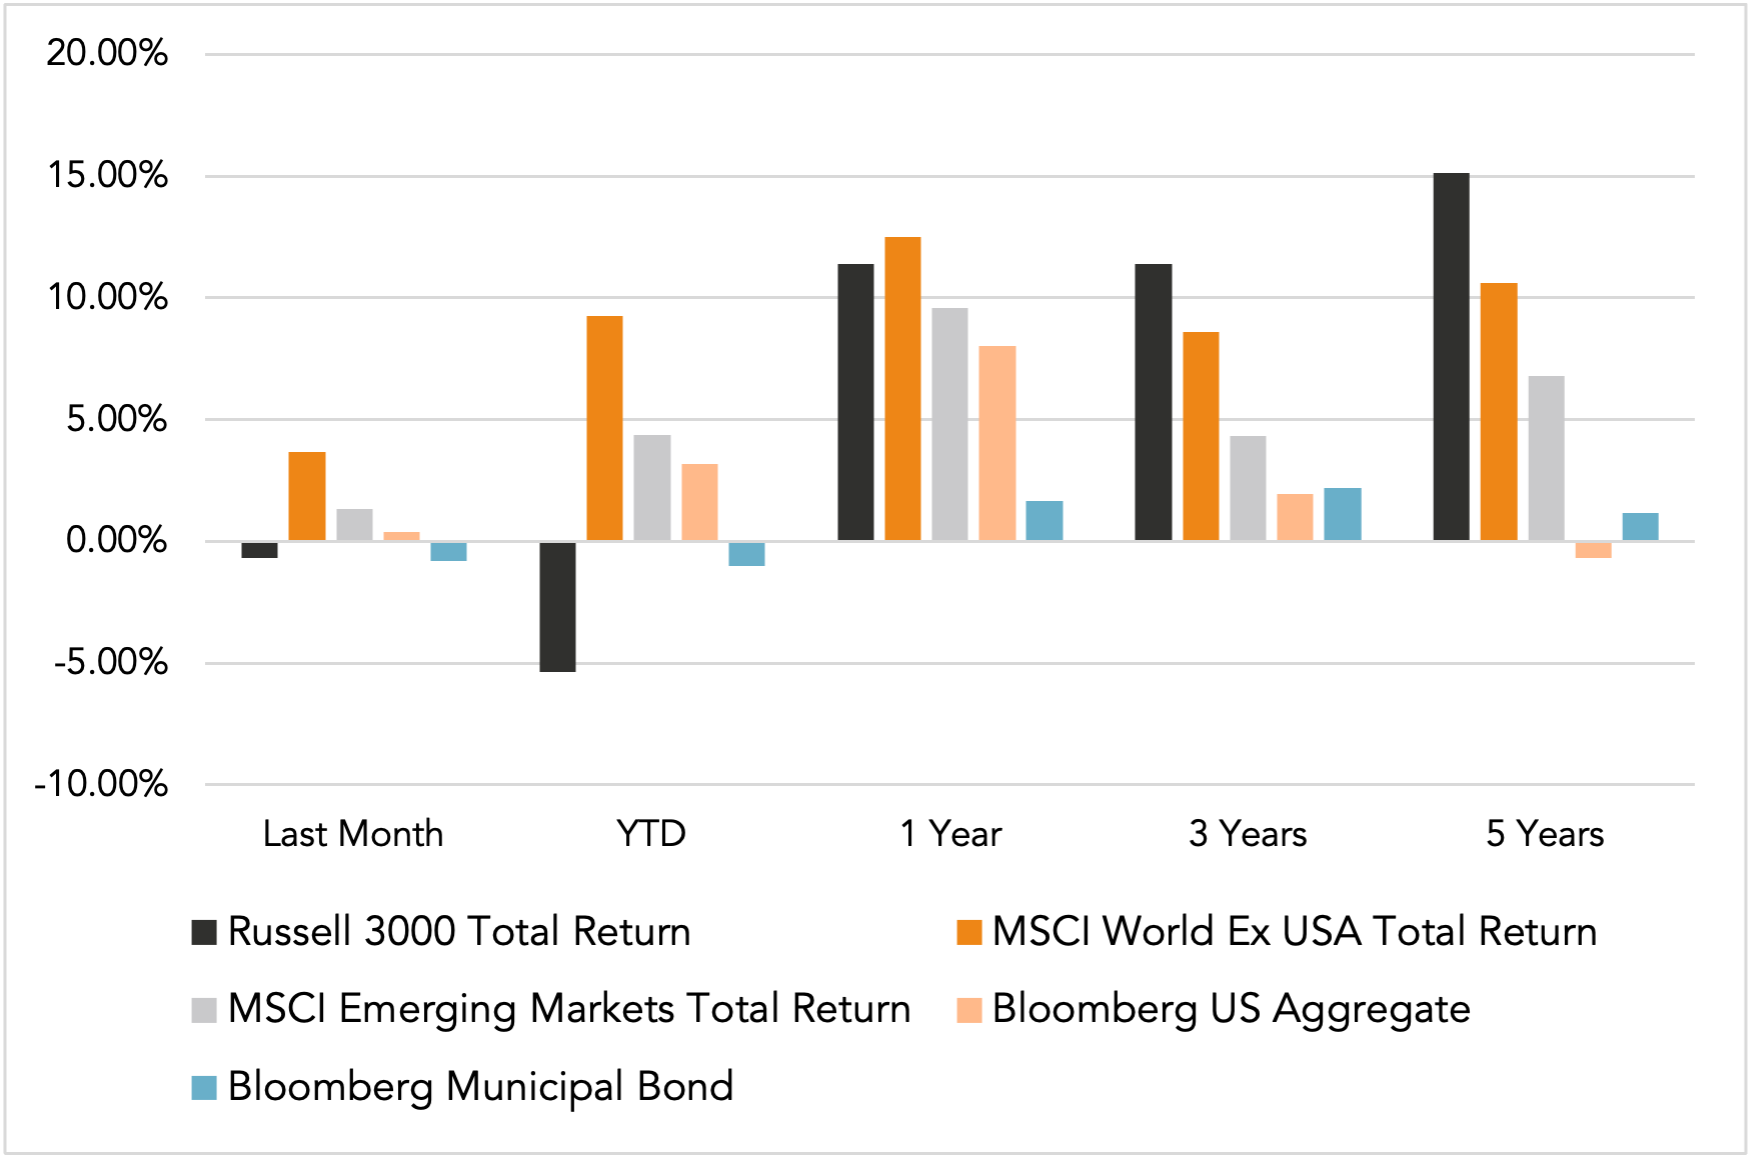
Major Market Index Returns
Period Ending 5/1/2025
Multi-year returns are annualized.
Mix Index Returns
Global Equity / US Taxable Bonds
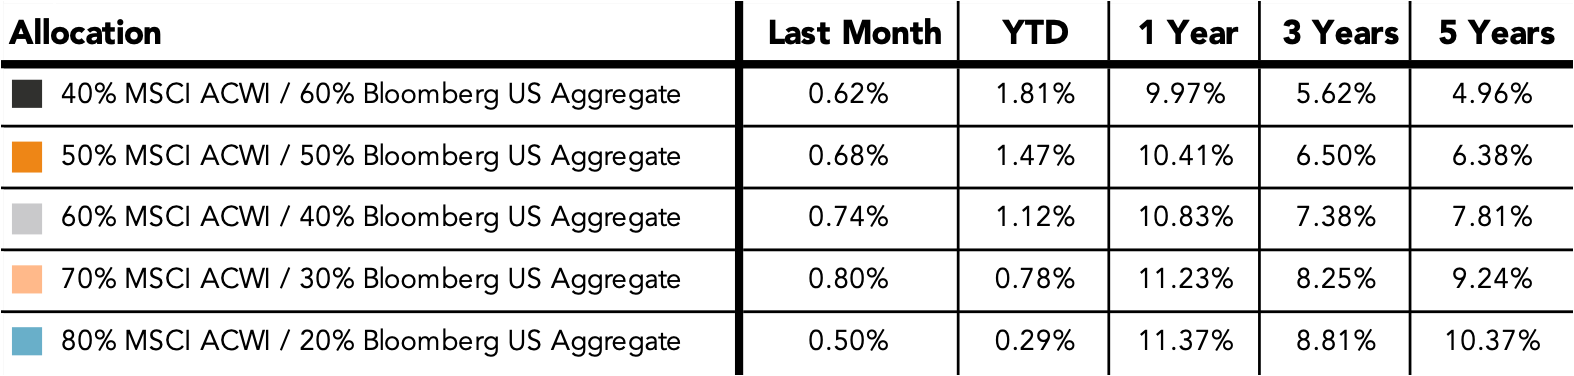
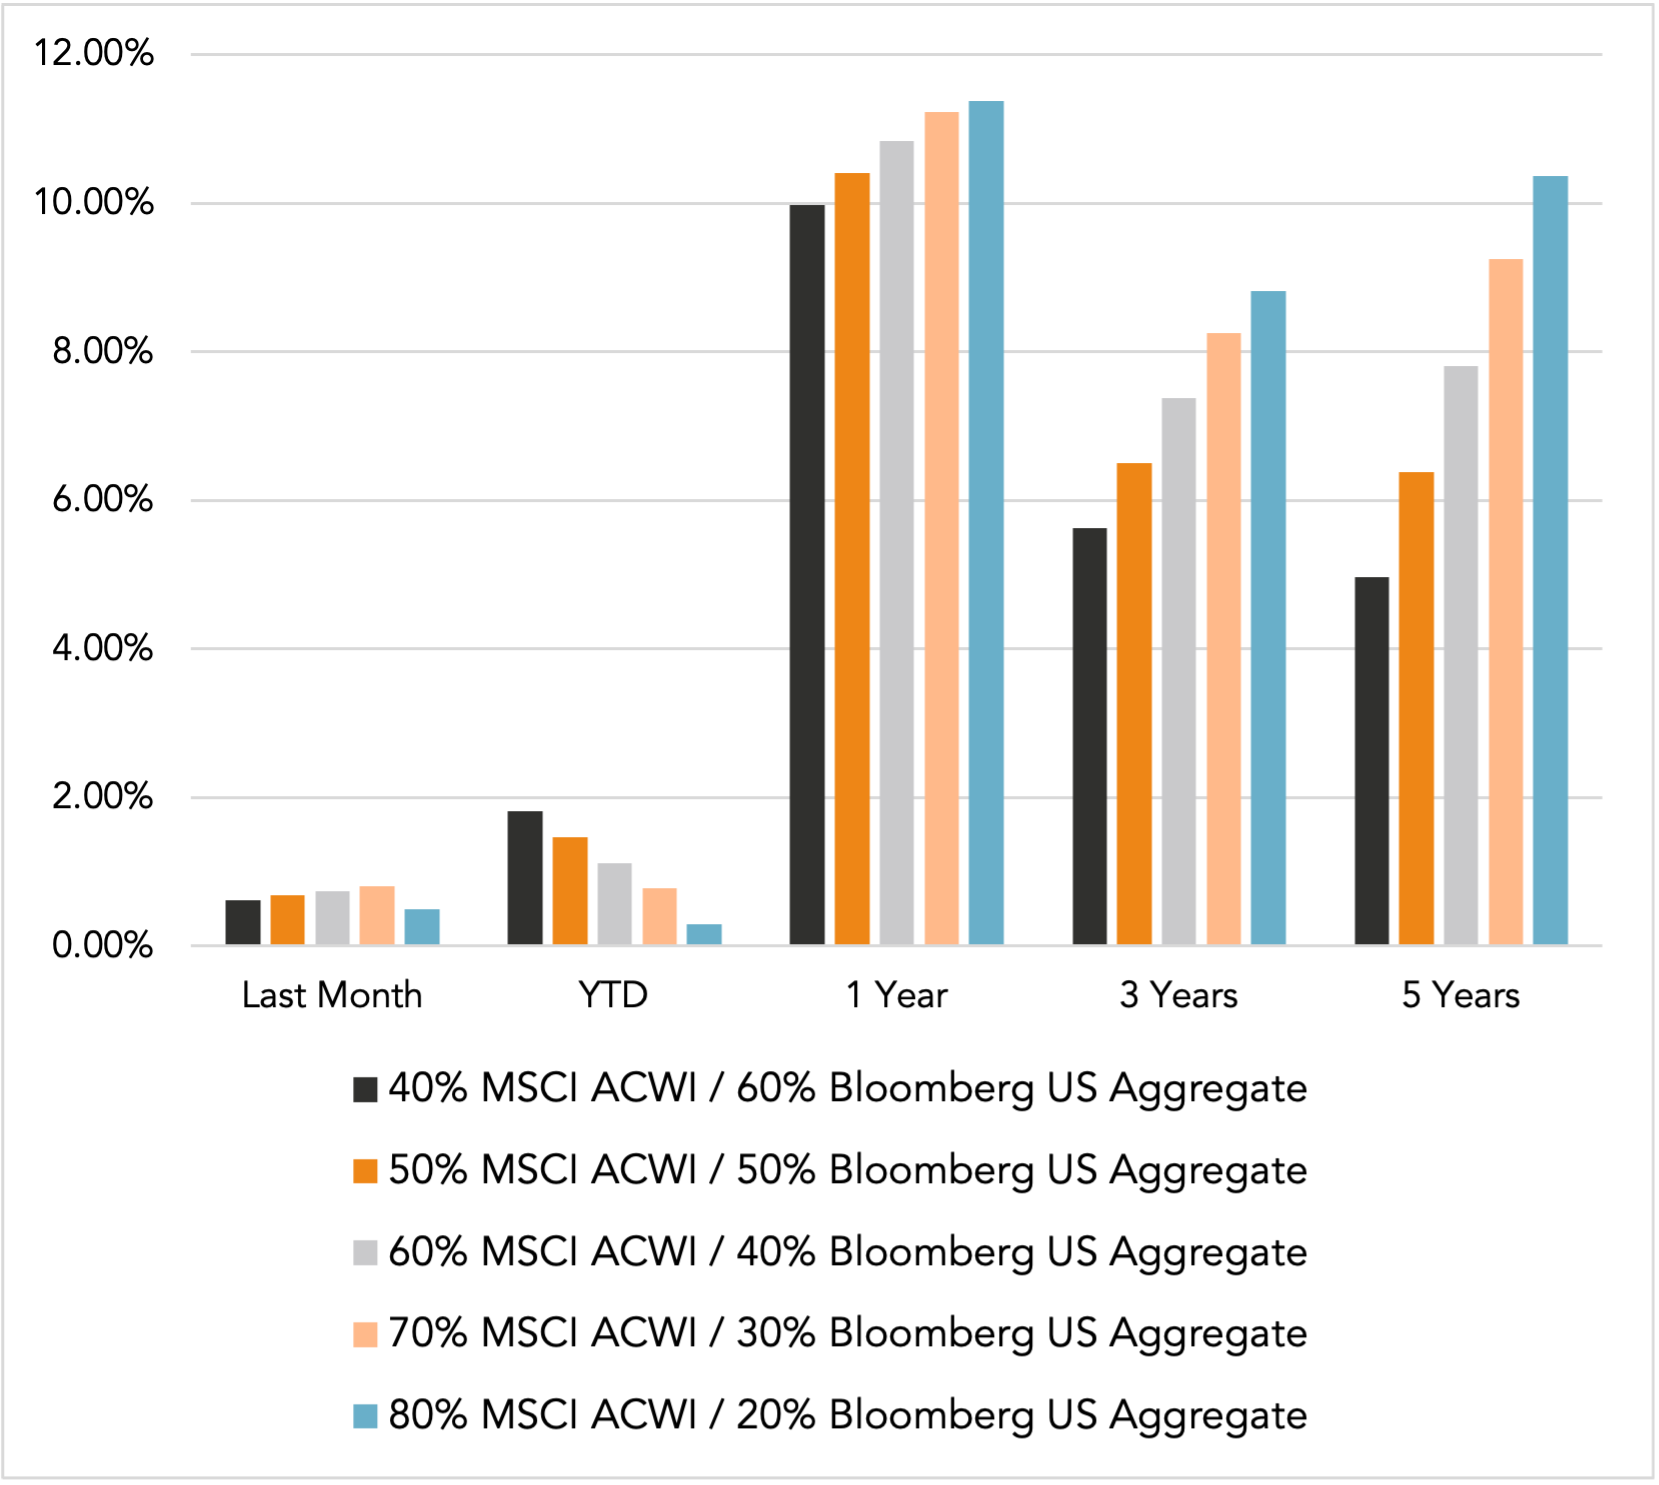
Indexes are unmanaged and cannot be directly invested into. Past performance is no indication of future results. Investing involves risk and the potential to lose principal.
The Russell 3000 Index is a United States market index that tracks the 3000 largest companies. MSCI Emerging Markets Index is a broad market cap-weighted Index showing the performance of equities across 23 emerging market countries defined as emerging markets by MSCI. MSCI ACWI ex-U.S. Index is a free-float adjusted market capitalization-weighted index that is designed to measure the equity market performance of developed and emerging markets excluding companies based in the United States. Bloomberg U.S. Aggregate Bond Index represents the investment-grade, U.S. dollar-denominated, fixed-rate taxable bond market, including Treasuries, government-related and corporate securities, as well as mortgage and asset-backed securities. Bloomberg Municipal Index is the US Municipal Index that covers the US dollar-denominated long-term tax-exempt bond market. The index has four main sectors: state and local general obligation bonds, revenue bonds, insured bonds, and prerefunded bonds.

Monthly Market Update – June 2026