
Please find our most recent market review below. We hope these perspectives are valuable to you.
– The AdvicePeriod Team
Key observations
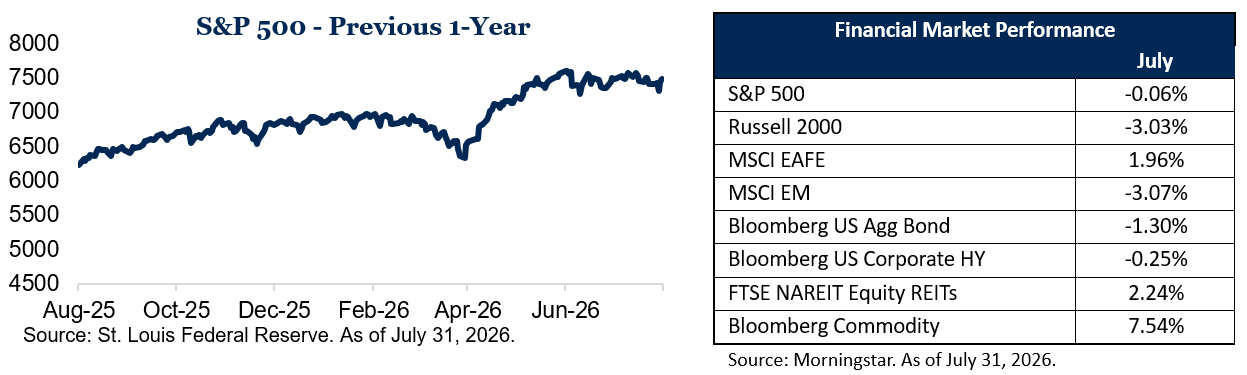
- Equities logged a rare down July, but earnings and breadth provided ballast. The S&P 500 finished the month with a modest decline—its first negative July since 2014, as investors weighed Federal Reserve policy, mixed corporate earnings and shifting artificial intelligence (AI)-spending expectations—with semiconductor names hit hardest. Even so, strength broadened into technology consulting, software, cybersecurity and digital payments, easing concerns about narrow AI-driven leadership.
- The Fed held rates steady, but a historic three-way dissent underscored growing inflation unease. The FOMC voted 9-3 to hold the federal funds rate at 3.5% to 3.75%, with three regional presidents dissenting in favor of a hike—the first three-way dissent on rate direction since September 2016. Long-term Treasury yields moved higher around the decision, with the 30-year bond yield spiking to its highest level since 2007.
- Labor and inflation data pointed in opposite directions, then a reignited Iran conflict complicated the picture further. June payrolls rose by just 57,000 versus a 115,000 consensus forecast, even as June CPI cooled sharply to 3.5% year-over-year with core inflation easing more than expected to 2.6%. That encouraging trend was muddied late in the month as renewed fighting around the Strait of Hormuz pushed oil back toward $90 a barrel, reviving energy-driven inflation concerns.
July 2026 delivered a month of genuine crosscurrents: A rare down month for U.S. equities that nonetheless ended with encouraging breadth, a Federal Reserve decision marked by unusual internal disagreement and economic data that alternately reassured and unsettled markets as a familiar geopolitical flashpoint reignited late in the month. Below, we walk through what happened and why it matters.
Equities: A rare down July, but with encouraging undercurrents
The S&P 500 finished July down only about 0.1%—a razor-thin decline, but enough to end an eleven-year streak of positive Julys dating back to 2015, marking the index’s first negative July since 2014. The damage was concentrated almost entirely in semiconductors, where the group of chipmakers closed out the month little changed but still posted their worst monthly performance since 2008, as investors reassessed the pace of AI-related capital spending.
Beneath that headline figure, the month’s story was more constructive. Leadership shifted away from the usual AI hardware names toward technology consulting, enterprise software, digital payments and insurance services, with several large-cap companies posting standout earnings-driven gains even as the broader index struggled. This broadening of leadership away from a narrow set of winners is generally viewed as a healthy sign for market participation.
The month also ended on a strong note. On the final trading day of July, the S&P 500 added 0.7% and the Dow gained 0.53%, with the Dow posting its fourth consecutive winning month even as investors looked past a fresh climb in bond yields. This pattern—volatility around AI valuations and policy uncertainty, followed by a resilient finish —has become a familiar rhythm in 2026, and July was no exception.
The Federal Reserve: A historic split, even as policy stayed on hold
The most notable policy development of the month came on July 29, when the Federal Open Market Committee (FMOC) voted 9 to 3 to hold its benchmark rate steady at 3.5% to 3.75% for a fifth consecutive meeting, with the ongoing conflict in the Middle East clouding the outlook for inflation. Three regional Federal Reserve presidents—Cleveland’s Beth Hammack, Minneapolis’s Neel Kashkari, and Dallas’ Lorie Logan—dissented in favor of a quarter-point hike instead, marking the first time since Sept. 2016 that three policymakers have dissented in the same direction on rates.
The split reflects a genuine divide within the Fed about how to weigh persistent inflation against a cooling labor market, a tension that new Fed Chair Kevin Warsh has openly embraced. At his post-meeting press conference, Warsh told reporters, “I asked for a good family fight, and I got one.” Markets took notice: Long-term Treasury yields moved higher in the days around the decision, with the 30-year Treasury yield spiking to its highest level since 2007, touching roughly 5.25% by month-end as investors weighed questions about the Fed’s resolve on inflation.
Labor market cooling, inflation easing and a familiar geopolitical risk returns
Economic data released during July told two different stories. On the labor side, the June jobs report, released July 2, showed nonfarm payrolls rising by just 57,000, well below the 115,000 economists had forecast and slower than May’s downwardly revised 129,000 gain. The unemployment rate ticked down to 4.2%, though that improvement was driven largely by a decline in labor force participation to 61.5%, its lowest level since March 2021, rather than by stronger hiring.
On the inflation side, the news was more encouraging. June CPI data, released July 14, showed headline inflation easing to 3.5% year-over-year, down from May’s three-year high of 4.2%, while core inflation cooled to 2.6% year-over-year from 2.9% in May. That improving trend, however, ran into a complication late in the month. After a mid-June memo of understanding had allowed oil prices to retreat toward pre-conflict levels, fighting between the United States and Iran around the Strait of Hormuz resumed in July, with Iran attacking tankers transiting the waterway and shipping traffic through the strait declining sharply. By July 31, West Texas Intermediate crude had climbed back to roughly $84.67 per barrel and Brent to about $90.12, reintroducing the kind of energy-driven inflation risk that has periodically resurfaced throughout 2026.
Putting July in context
Taken together, July 2026 was a month of genuine tension between improving and worsening signals: a down month for the S&P 500 that still showed healthy participation beneath the surface; a Fed that held policy steady but revealed real disagreement about the path ahead; and an inflation picture that brightened on the data front even as a resurgent conflict in the Middle East reminded investors how quickly energy markets can shift the calculus. None of these developments represents a decisive turn in either direction—rather, they reflect the kind of crosscurrents that have characterized much of this year’s economic and market environment.
We will continue to monitor the Fed’s policy path, the trajectory of the Iran conflict and its effect on energy prices, and incoming labor and inflation data as we move into the fall. As always, thank you for your continued trust.
This market commentary is meant for informational and educational purposes only and does not consider any individual personal considerations. As such, the information contained herein is not intended to be personal investment advice or a recommendation of any kind. The commentary represents an assessment of the market environment through July 2026.
The views and opinions expressed may change based on the market or other conditions. The forward-looking statements are based on certain assumptions, but there can be no assurance that forward-looking statements will materialize.
Equity securities are subject to price fluctuation and investments made in small and mid-cap companies generally involve a higher degree of risk and volatility than investments in large-cap companies. International securities are generally subject to increased risks, including currency fluctuations and social, economic, and political uncertainties, which could increase volatility. These risks are magnified in emerging markets.
Fixed-income securities are subject to loss of principal during periods of rising interest rates and are subject to various other risks including changes in credit quality, market valuations, liquidity, prepayments, early redemption, corporate events, tax ramifications, and other factors before investing. Interest rates and bond prices tend to move in opposite directions. When interest rates fall, bond prices typically rise, and conversely, when interest rates rise, bond prices typically fall.
There is no assurance that any investment, plan, or strategy will be successful. Investing involves risk, including the possible loss of principal. Past performance does not guarantee future results, and nothing herein should be interpreted as an indication of future performance. Please consult your financial professional before making any investment or financial decisions.
AdvicePeriod is another business name and brand utilized by both Mariner, LLC and Mariner Platform Solutions, LLC, each of which is an SEC registered investment adviser. Registration of an investment adviser does not imply a certain level of skill or training. For additional information about Mariner, LLC or Mariner Platform Solutions, LLC, including fees and services, please contact us utilizing the contact information provided herein or refer to the Investment Adviser Public Disclosure website.
For additional information as to which entity your adviser is registered as an investment adviser representative, please refer to the Investment Adviser Public Disclosure website or the Form ADV 2B provided to you. Investment adviser representatives of Mariner, LLC are generally employees. Investment adviser representatives of Mariner Platform Solutions, LLC dba AdvicePeriod, are independent contractors.
Indexes referenced are unmanaged and cannot be directly invested into. For index definitions visit https://www.marinerwealthadvisors.com/index-definitions/
Does past performance matter?
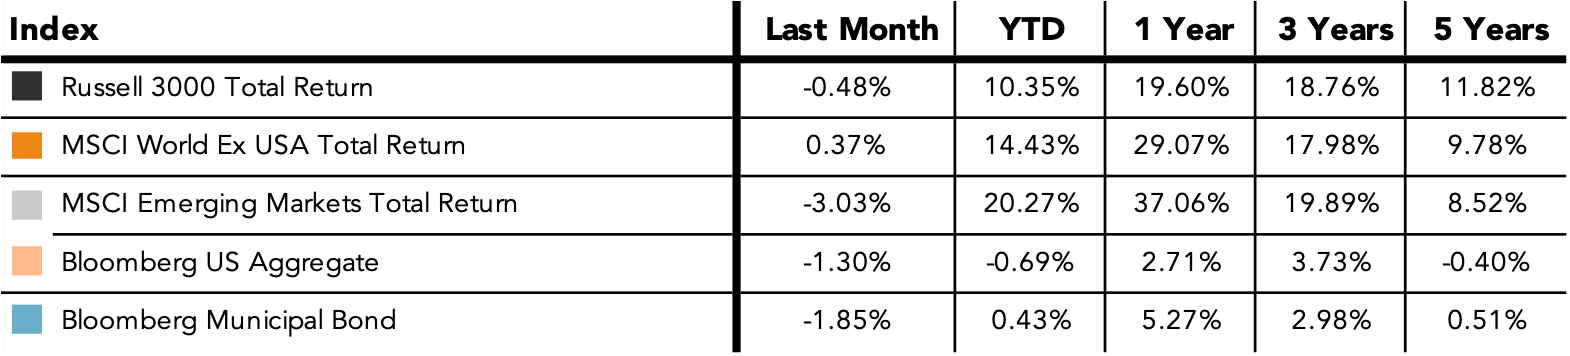
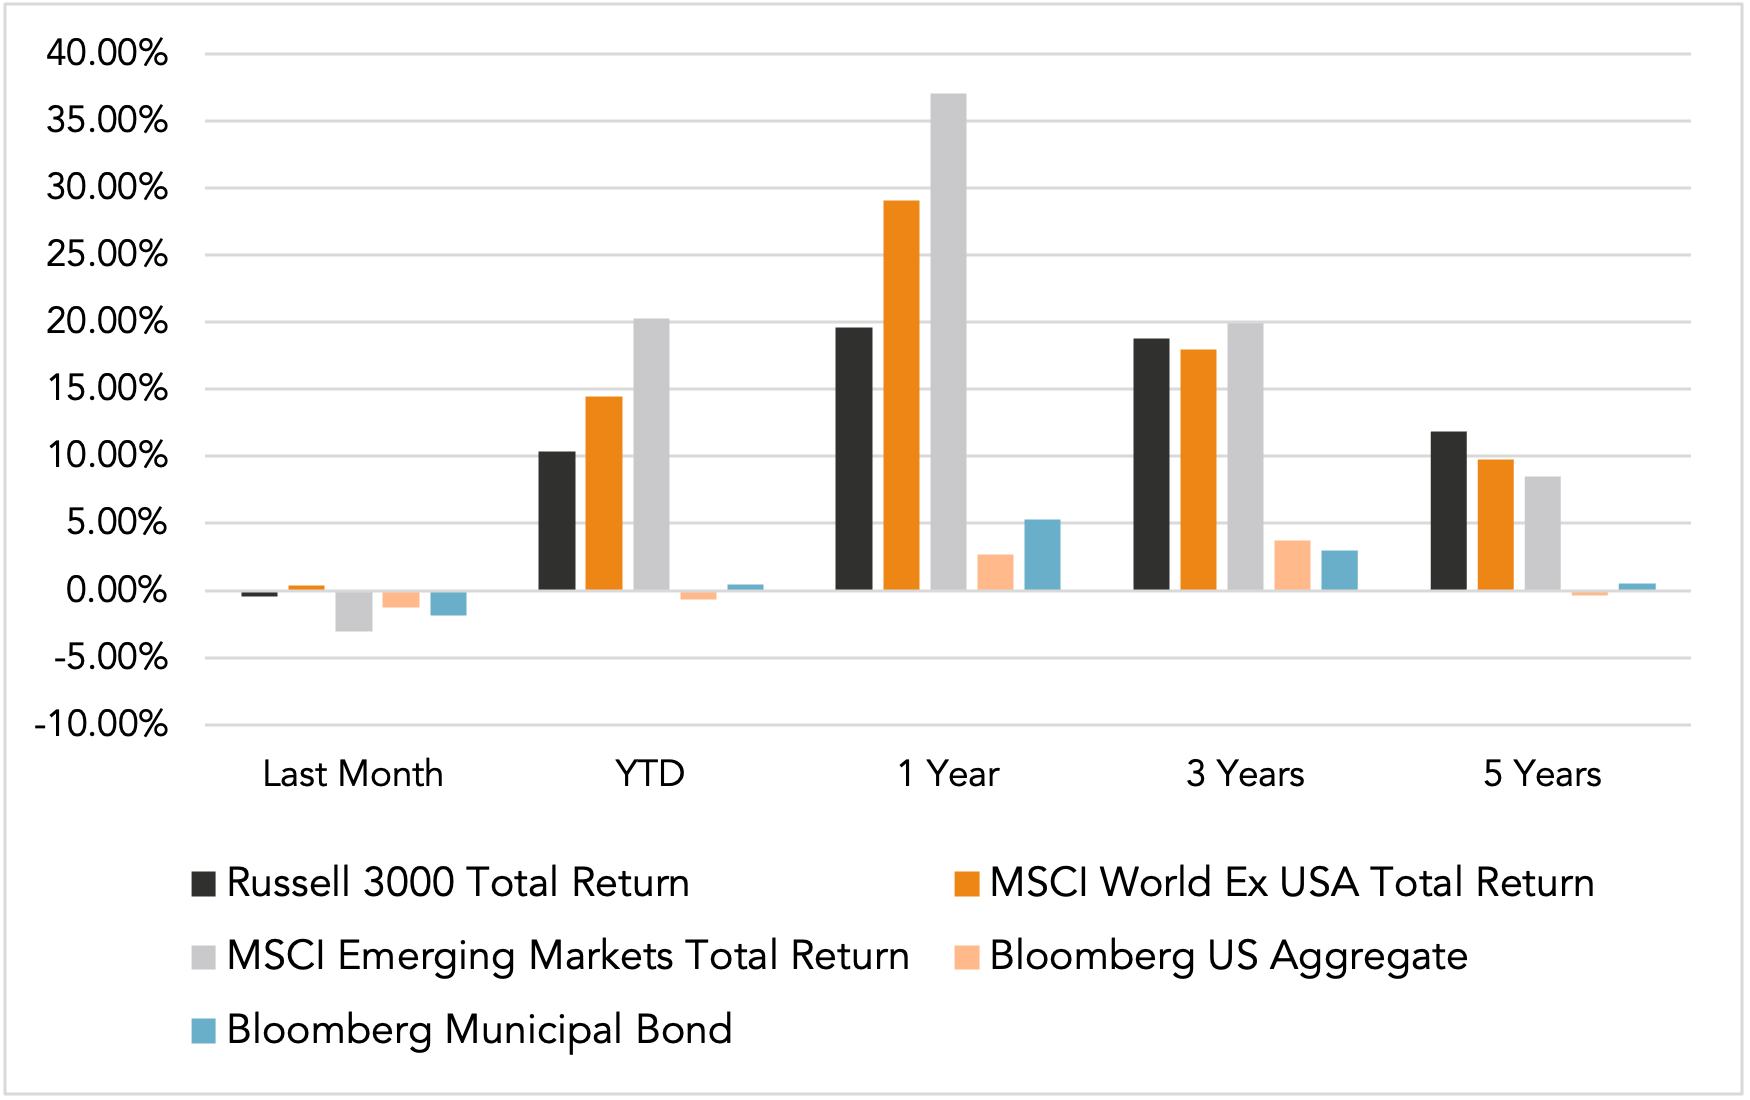
Major Market Index Returns
Period Ending 7/1/2026
Multi-year returns are annualized.
Mix Index Returns
Global Equity / US Taxable Bonds
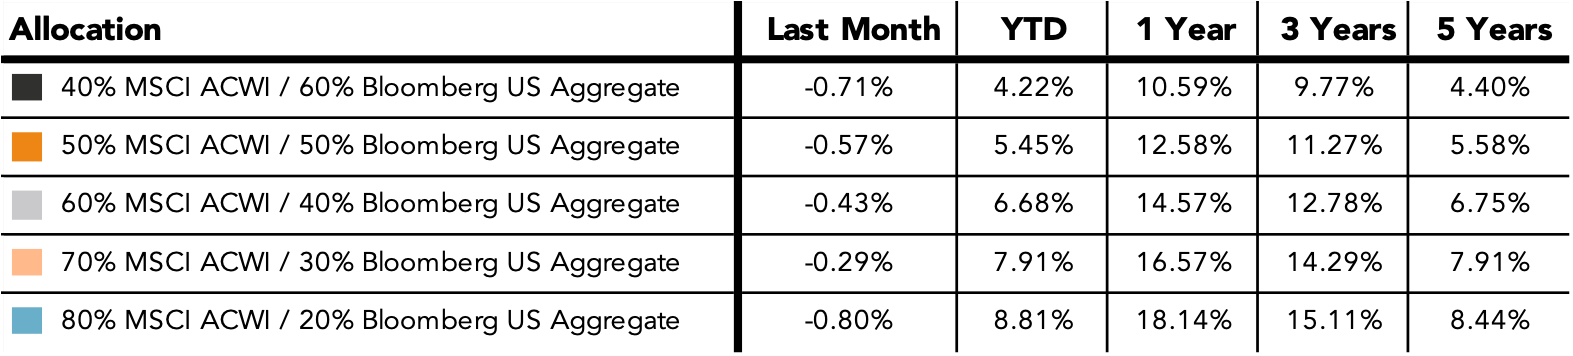
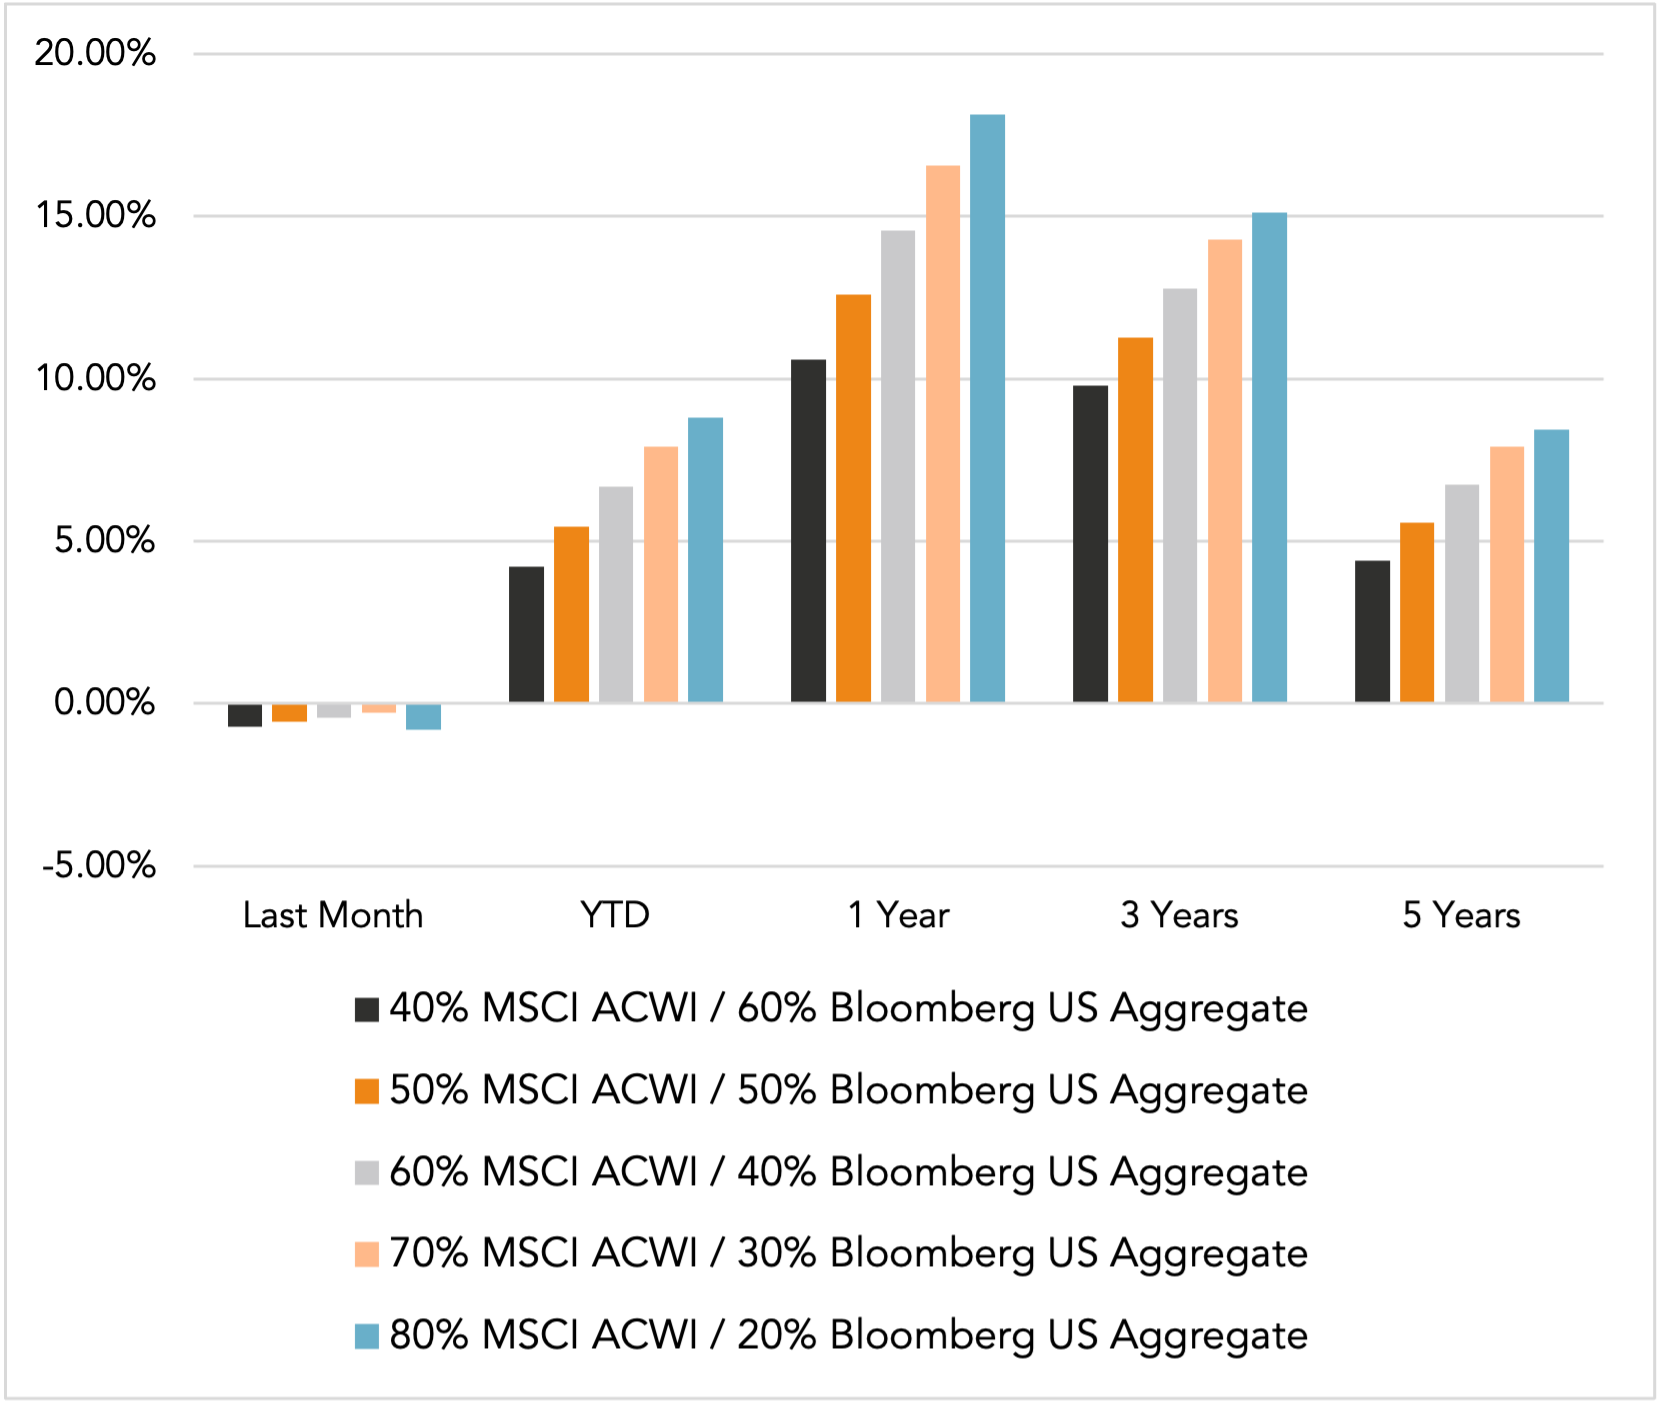
Indexes are unmanaged and cannot be directly invested into. Past performance is no indication of future results. Investing involves risk and the potential to lose principal.
The Russell 3000 Index is a United States market index that tracks the 3000 largest companies. MSCI Emerging Markets Index is a broad market cap-weighted Index showing the performance of equities across 23 emerging market countries defined as emerging markets by MSCI. MSCI ACWI ex-U.S. Index is a free-float adjusted market capitalization-weighted index that is designed to measure the equity market performance of developed and emerging markets excluding companies based in the United States. Bloomberg U.S. Aggregate Bond Index represents the investment-grade, U.S. dollar-denominated, fixed-rate taxable bond market, including Treasuries, government-related and corporate securities, as well as mortgage and asset-backed securities. Bloomberg Municipal Index is the US Municipal Index that covers the US dollar-denominated long-term tax-exempt bond market. The index has four main sectors: state and local general obligation bonds, revenue bonds, insured bonds, and prerefunded bonds.


Monthly Market Update – June 2026