
Please find our most recent market review below. We hope these perspectives are valuable to you.
– The AdvicePeriod Team
Key observations
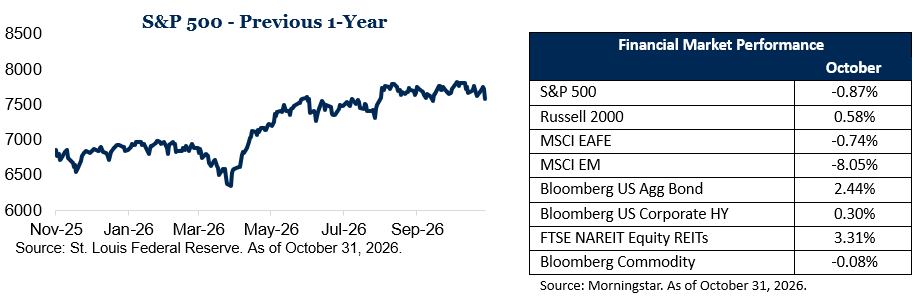
- Stock market indices had another mixed month of performance, with the S&P 500 falling 0.87%, the Nasdaq down 5.28% and the Dow Jones Industrial Average jumping 1.76%.
- Tech stocks tied to the AI boom came under pressure during October, as investors began to question the sustainability of massive capital expenditures and whether the return on investment will justify the spending.
- The bond market staged a rally during October after September’s rise in interest rates, with the Bloomberg US Aggregate Bond Index up 2.44% and the high yield index up 0.30%. The 10-year Treasury ended the month at 4.94%, down from 5.29% at the end of September.
October was a month of reversals. The artificial intelligence (AI)-driven leadership that carried the Nasdaq higher in September gave way to a broad rotation, as investors questioned how long record spending on the AI infrastructure buildout can last. Non-tech stocks, small-caps and value stocks all saw gains. At the same time, bonds recovered some of September’s losses, helping to cushion tech stock declines for diversified investors. More on these key market drivers below.
Market Recap
AI worries hit tech stocks
The Nasdaq closed at a record high on Oct. 6, before sliding for the rest of the month as investors questioned whether spending on AI infrastructure can keep growing at its current rate. Third-quarter earnings were generally strong, but investors focused on massive AI spending that may or may not be justified by future returns. Signs of AI-related stress also appeared in the credit markets. Yields on bonds issued by CoreWeave, a major provider of AI computing capacity, climbed above 15%, and its stock fell about 37% during the month.
Below the surface, though, much of the market did well. The equal-weighted S&P 500 outperformed the cap-weighted index by 5.9 percentage points, while value stocks beat growth stocks by more than 10 percentage points. Mid- and small-cap stocks also gained, and the Dow finished higher.
October’s performance is a reminder that market leadership can change quickly, and that owning a diversified portfolio can help manage the risks of changing market leadership.
International stocks fell, with the developed markets-focused MSCI EAFE index down about 0.74%, while emerging markets dropped by about 8%, led by weakness in chip stocks such as Taiwan Semiconductor Manufacturing and SK Hynix.
Bonds rebound as the Fed holds steady
The bond market recovered after a difficult September. The Bloomberg US Aggregate Bond Index rose about 2.4% in October after falling 2.6% in September, and the 10-year Treasury yield ended the month at 4.94%, down from 5.29% at the end of September. Bonds once again helped offset stock market losses, a useful reminder of why they remain a core part of a diversified portfolio.
On Oct. 28, the Federal Open Market Committee voted to keep the federal funds target range at 3.75% to 4.0%, following its September increase that was the first under Fed Chair Kevin Warsh. The central bank remains concerned about inflation but said it would like to see more information before deciding whether to raise interest rates again this year. Markets currently expect to see another increase before the end of the year.
Oil prices rose during October, with Brent crude rising about 4% and WTI Crude jumping roughly 11 percent. Rising energy costs have been a consistent contributor to inflation this year.
Putting the month in context
October showed an economy that is growing faster than expected but still contending with stubborn inflation. Third quarter GDP grew at a 3.4% annualized rate, up from 2.2% in the second quarter. Business investment tied to AI was a major driver, along with consumer spending. Housing remained weak, as higher mortgage rates weigh on sales of both new and existing homes.
Inflation continues to be a headwind, with September’s consumer price index increasing 0.6% for the month and 3.7% from a year earlier, up from 3.4% in August. Core inflation, which excludes food and energy, rose 2.6%. Gasoline prices accounted for about half of the monthly increase. With wage growth around 3%, many households are feeling the squeeze.
The job market has cooled but remains stable. The U.S. added 29,000 jobs in September and the unemployment rate stood at 4.2%.
Looking ahead to November
November opened with the U.S. midterm elections on Nov. 3, which saw Democrats take control of both the House and Senate. The next read on inflation is scheduled for Nov. 10 and could shape the Fed’s thinking on further rate hikes. Investors will also watch oil prices and developments in the Middle East, along with whether the recent rotation away from technology stocks continues. As always, we will continue to monitor these and other developments and keep you informed.
Thank you for your continued trust.
This market commentary is meant for informational and educational purposes only and does not consider any individual personal considerations. As such, the information contained herein is not intended to be personal investment advice or a recommendation of any kind. The commentary represents an assessment of the market environment through October 2026.
The views and opinions expressed may change based on the market or other conditions. The forward-looking statements are based on certain assumptions, but there can be no assurance that forward-looking statements will materialize.
Equity securities are subject to price fluctuation and investments made in small and mid-cap companies generally involve a higher degree of risk and volatility than investments in large-cap companies. International securities are generally subject to increased risks, including currency fluctuations and social, economic, and political uncertainties, which could increase volatility. These risks are magnified in emerging markets.
Fixed-income securities are subject to loss of principal during periods of rising interest rates and are subject to various other risks including changes in credit quality, market valuations, liquidity, prepayments, early redemption, corporate events, tax ramifications, and other factors before investing. Interest rates and bond prices tend to move in opposite directions. When interest rates fall, bond prices typically rise, and conversely, when interest rates rise, bond prices typically fall.
There is no assurance that any investment, plan, or strategy will be successful. Investing involves risk, including the possible loss of principal. Past performance does not guarantee future results, and nothing herein should be interpreted as an indication of future performance. Please consult your financial professional before making any investment or financial decisions.
AdvicePeriod is another business name and brand utilized by both Mariner, LLC and Mariner Platform Solutions, LLC, each of which is an SEC registered investment adviser. Registration of an investment adviser does not imply a certain level of skill or training. For additional information about Mariner, LLC or Mariner Platform Solutions, LLC, including fees and services, please contact us utilizing the contact information provided herein or refer to the Investment Adviser Public Disclosure website.
For additional information as to which entity your adviser is registered as an investment adviser representative, please refer to the Investment Adviser Public Disclosure website or the Form ADV 2B provided to you. Investment adviser representatives of Mariner, LLC are generally employees. Investment adviser representatives of Mariner Platform Solutions, LLC dba AdvicePeriod, are independent contractors.
Indexes referenced are unmanaged and cannot be directly invested into. For index definitions visit https://www.marinerwealthadvisors.com/index-definitions/
Does past performance matter?
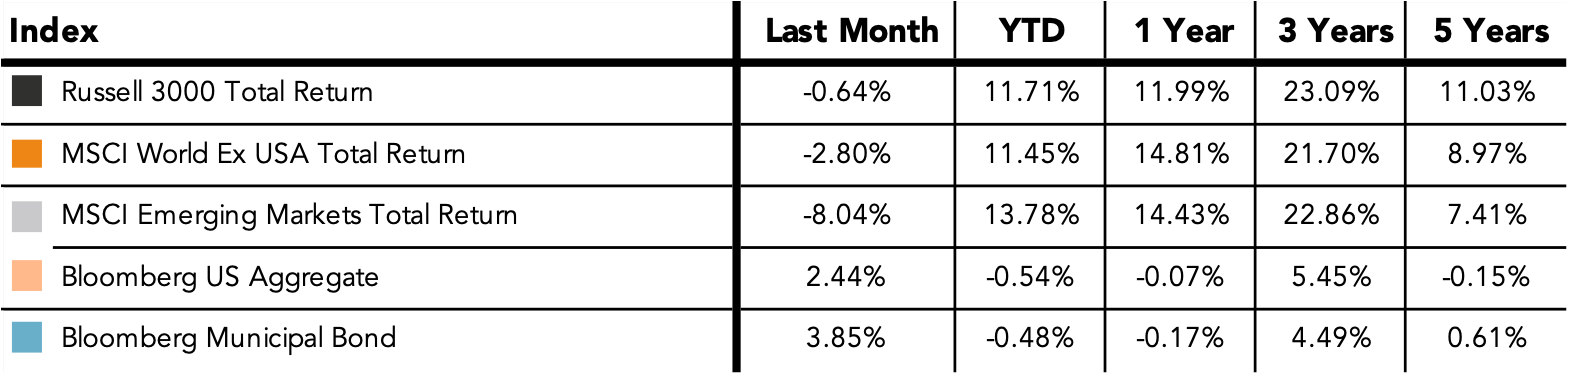
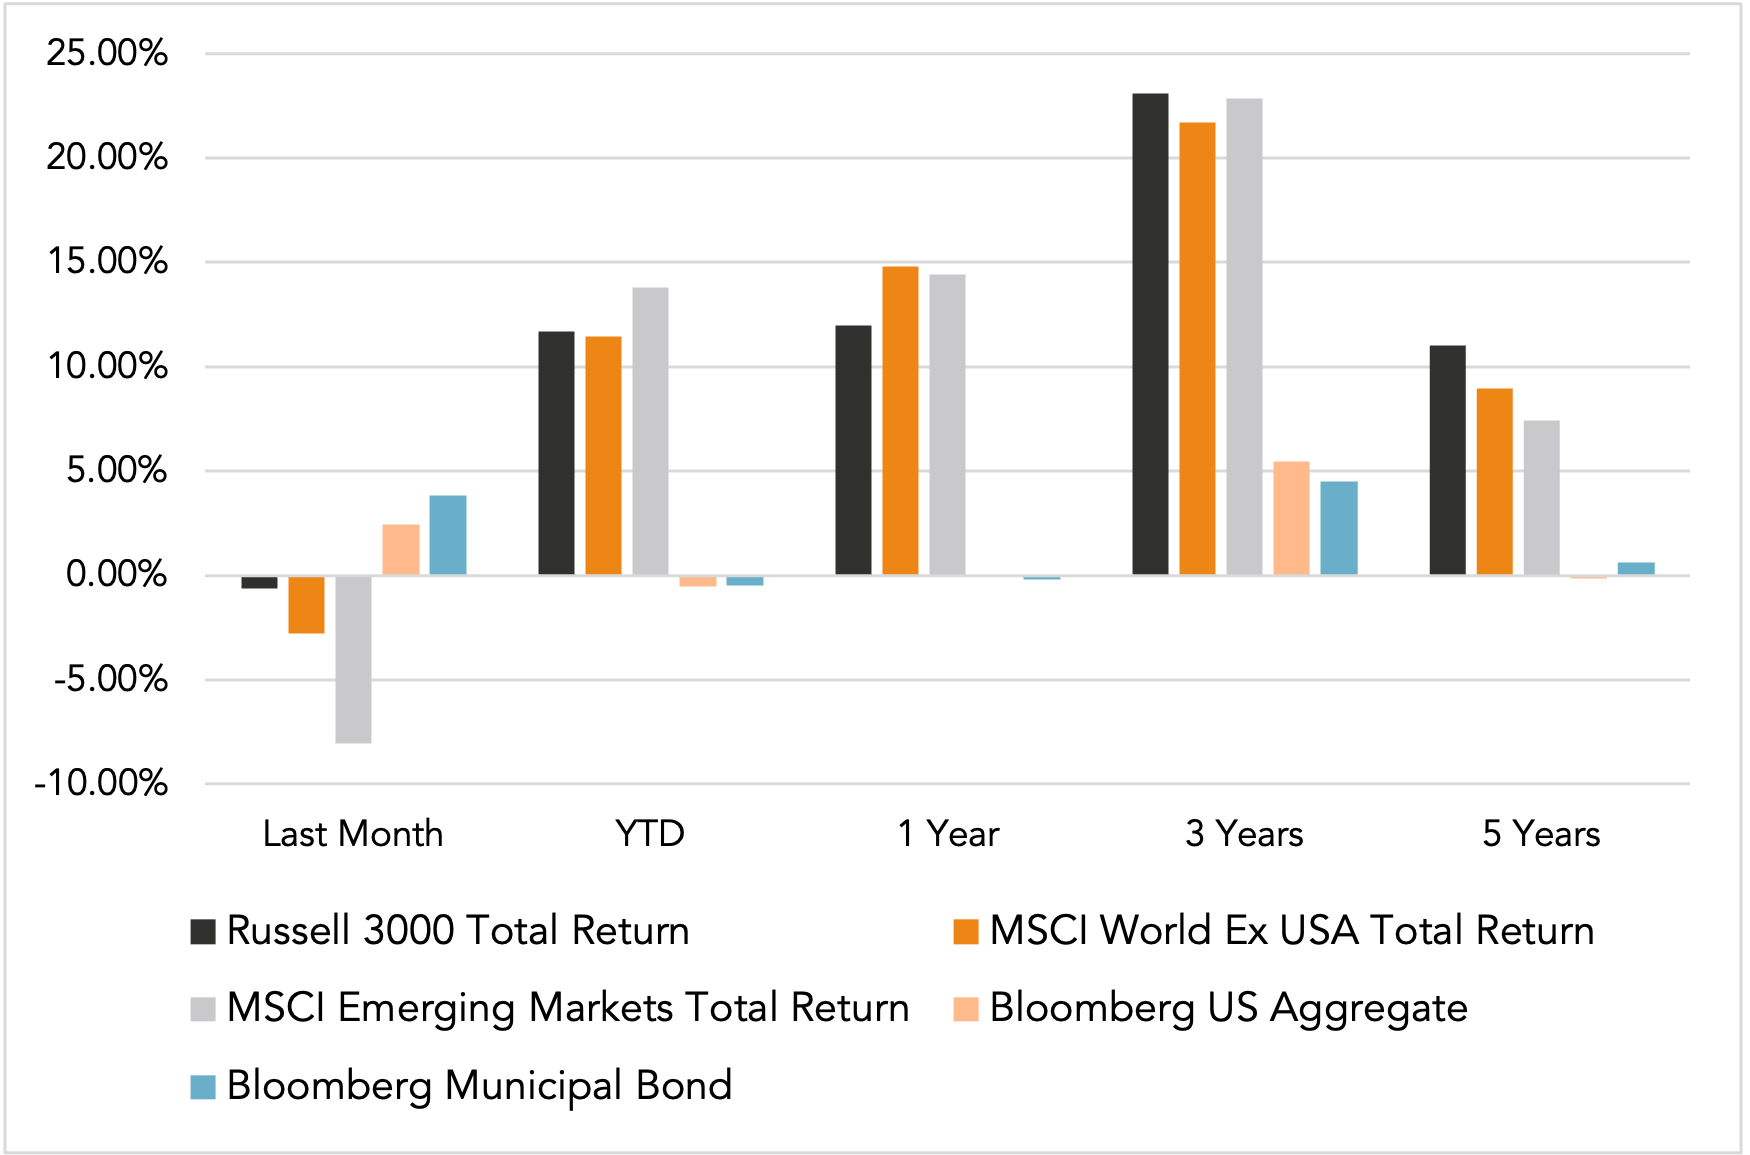
Major Market Index Returns
Period Ending 10/1/2026
Multi-year returns are annualized.
Mix Index Returns
Global Equity / US Taxable Bonds
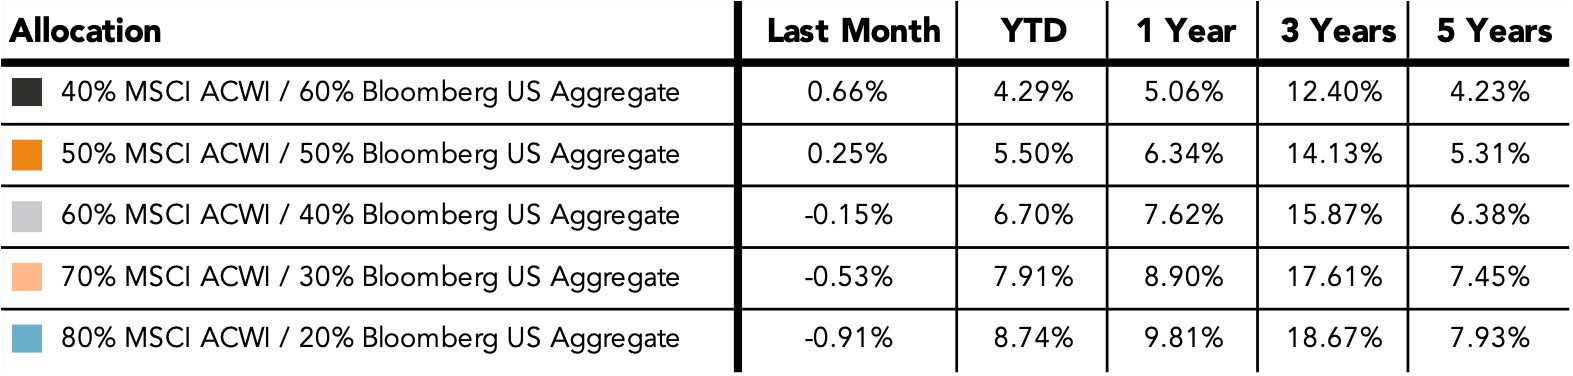
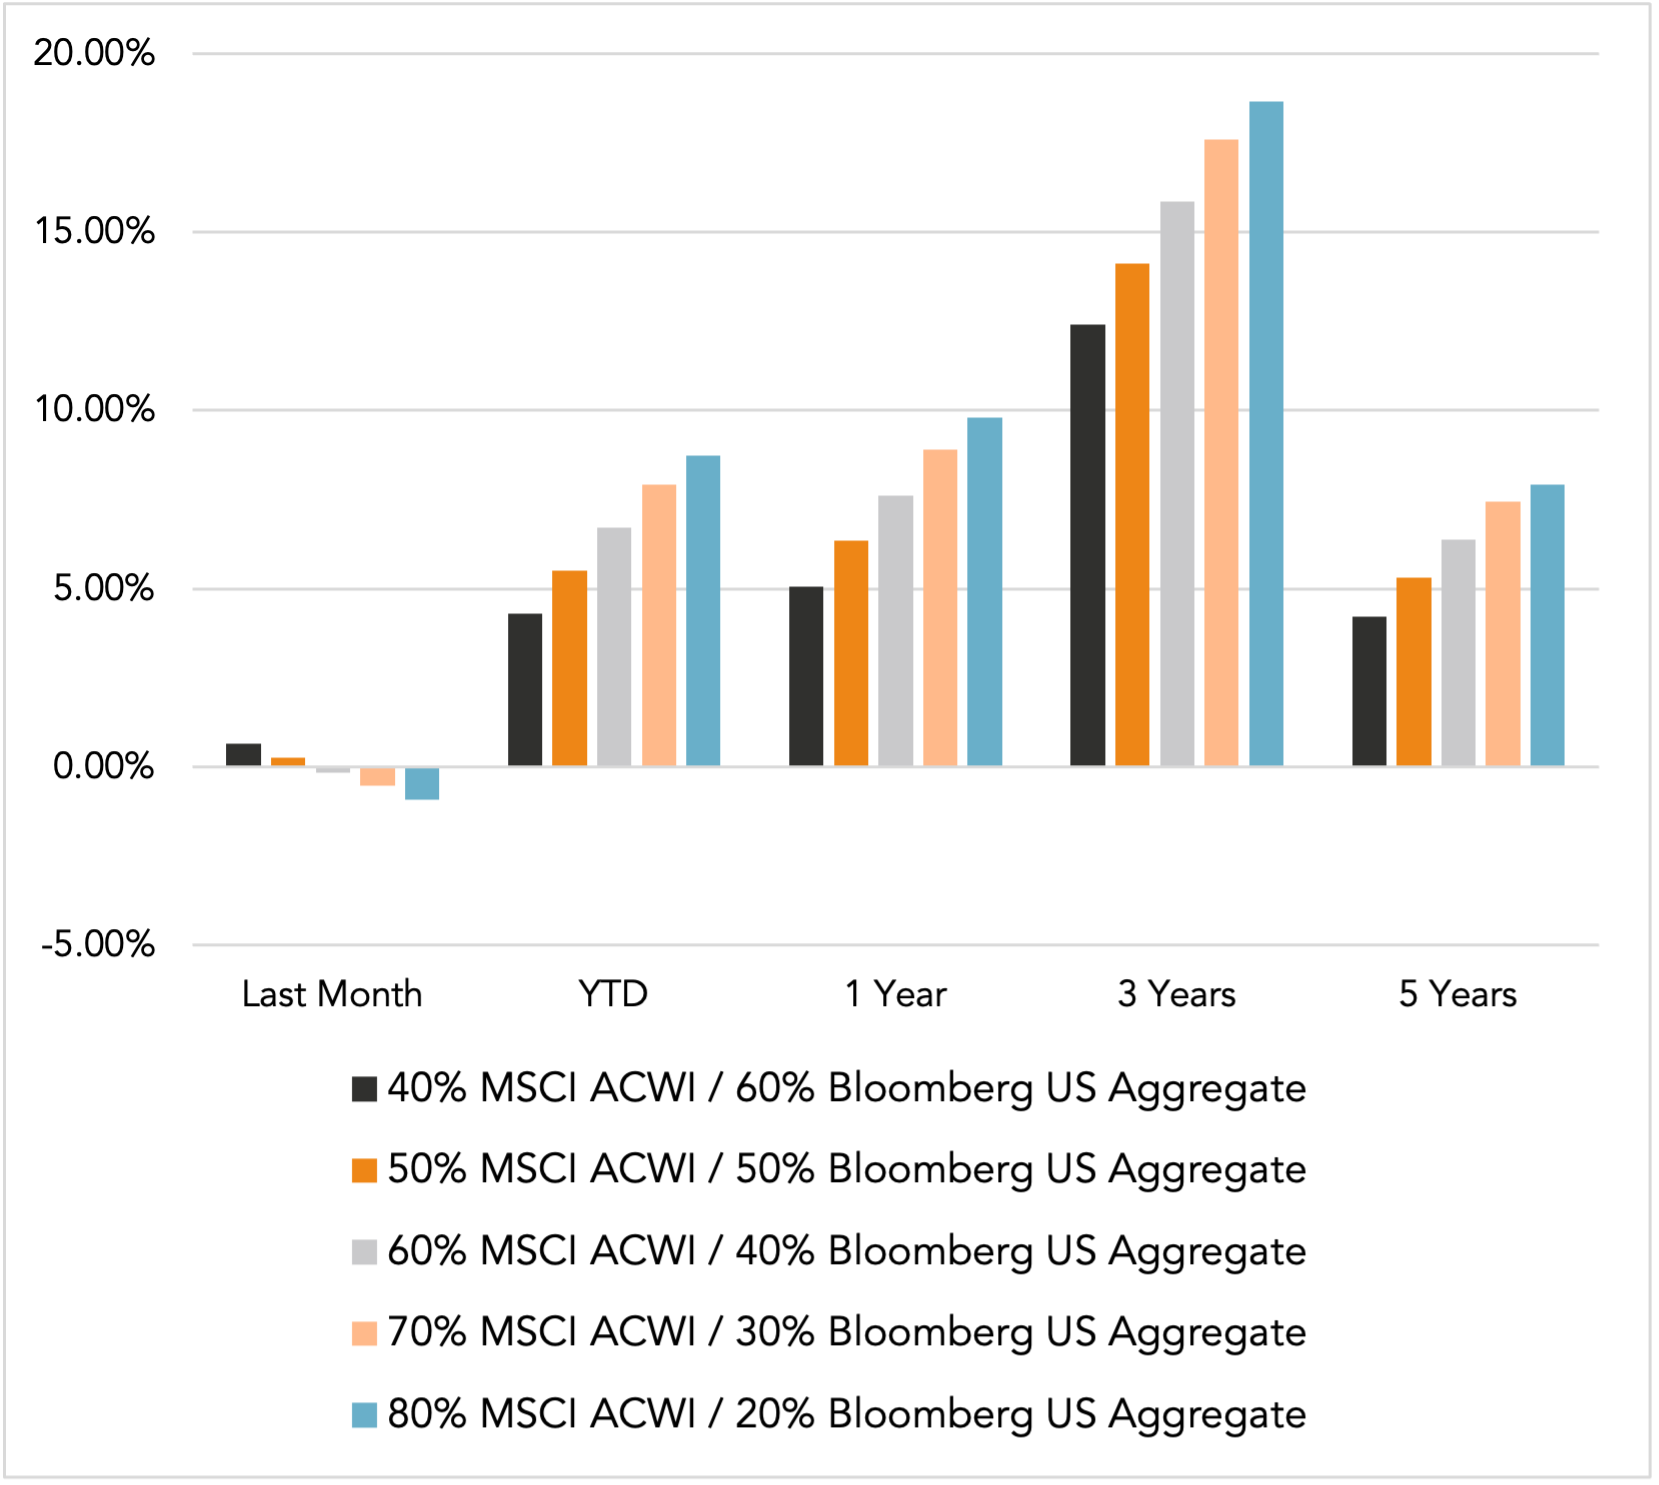
Indexes are unmanaged and cannot be directly invested into. Past performance is no indication of future results. Investing involves risk and the potential to lose principal.
The Russell 3000 Index is a United States market index that tracks the 3000 largest companies. MSCI Emerging Markets Index is a broad market cap-weighted Index showing the performance of equities across 23 emerging market countries defined as emerging markets by MSCI. MSCI ACWI ex-U.S. Index is a free-float adjusted market capitalization-weighted index that is designed to measure the equity market performance of developed and emerging markets excluding companies based in the United States. Bloomberg U.S. Aggregate Bond Index represents the investment-grade, U.S. dollar-denominated, fixed-rate taxable bond market, including Treasuries, government-related and corporate securities, as well as mortgage and asset-backed securities. Bloomberg Municipal Index is the US Municipal Index that covers the US dollar-denominated long-term tax-exempt bond market. The index has four main sectors: state and local general obligation bonds, revenue bonds, insured bonds, and prerefunded bonds.



Market Update: September 2026 in Review