Please find our most recent market review below. We hope these perspectives are valuable to you.
– The AdvicePeriod Team
Will good news on inflation continue to fuel the market rally?
Equity markets moved higher in January as inflation moderated and the Federal Reserve signaled a slower pace of rate hikes.
Key Observations
- The stock market rallied due to continued improvement in inflation and indications that the Fed rate hiking cycle may soon end.
- Bonds ended the month higher.
- International markets posted a strong advance, outperforming U.S. equities.
- The U.S. yield curve remains inverted, which has been a leading indicator of recession historically, but most economists expect the slowdown to be brief and shallow.
Market Recap
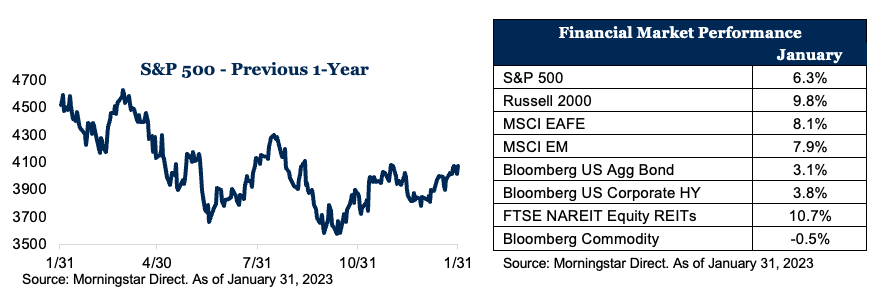
Stocks and bonds extended the rally into January, continuing to advance from the lows in October of last year. Investors were encouraged by economic data that showed signs of peaking inflation and the potential for a slowing pace of Fed rate hikes heading into 2023. Fears of a recession have moderated despite economic activity starting to slow. U.S. large-cap equities markets saw 6.3% returns, while small-cap stocks, as measured by the Russell 2000 Index, outperformed their larger counterparts, returning 9.8%. Non-U.S. equities rose in the month and modestly outpaced U.S. large-cap equities. The MSCI ACWI Index posted the biggest advance for the first two weeks in data going back to 1988. The strong performance contrasted with the World Bank warning of “one of the sharpest slowdowns we have seen in the past five decades.”1 The U.S. dollar weakened compared to many major currencies, providing an additional tailwind for international stocks. Emerging market equities also saw strong gains in the month. China remained in the headlines as the government eased restrictions on its zero-COVID policy, leading to the MSCI China returning nearly 12% in January.
Fixed income markets also generated positive returns for the month. The U.S. 10-year yield fell around 40 basis points, ending the month below 4% in response to better-than-expected inflation data.2 However, short-term rates moved higher after the Fed raised its target rate an additional 50 basis points at the December meeting. U.S. corporate high yield also fared well, outperforming the Barclays Aggregate index by 73 basis points. Other areas of the market such as REITs outperformed the broader equity markets, while commodities were one of the only major asset classes to have negative returns, dropping nearly 50 basis points in January.
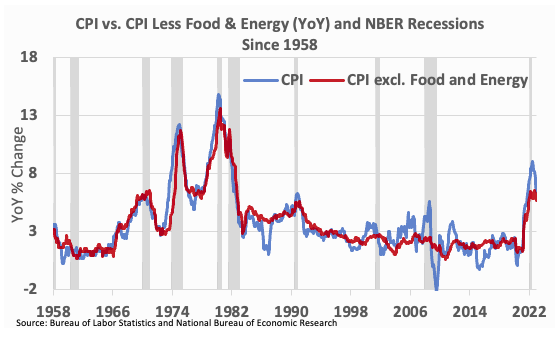
Inflation Is Cooling
The inflation benchmark, measuring price growth over a year, hit a 40-year high last June after months of sustained price increases. Since then, monthly gains have slowed significantly. Prices in December 2022 were up 6.5% from a year earlier, but inflation observed during the past six months equated to 1.9% annualized, close to the average annual rate of 1.7% between 2010 and 2020.3 Hopes for a quick return to lower inflation have encouraged bets that the Fed will pause or possibly even reverse its interest rate increase this year. Despite volatility, stocks have gained over 6% so far in 2023 and bonds have rallied. U.S. Treasury notes set to mature in January 2024 were yielding around 4.7% while inflation-protected Treasuries that come due in January 2024 were yielding 2.7%.4 The difference between those figures, called the breakeven inflation rate, suggests traders are betting that inflation will rise by about 2% over the next 12 months, which is the Fed’s target. Wagers on contracts known as CPI swaps, another way of betting on future inflation rates, show traders expecting roughly 2.1% inflation this year.5
U.S. economic activity is clearly slowing. Nominal retail sales declined 1.1%, while U.S. industrial production also declined 0.7% in December. U.S. existing home sales fell 1.5% in December, with housing starts and permits also declining. Economists continue to expect a mild recession beginning in the second quarter and lasting six months.6 The difference between the 10-year and 2-year Treasury yields is now the most inverted it has been since the 1980s, touching 84 basis points in early December.7 An inverted yield curve has historically been a warning sign of recession to come, and the Fed has made it clear it is willing to sacrifice growth to bring down inflation. Economic data shows the economy is clearly decelerating with PMI moderating and housing, retail sales and business spending slowing, but the U.S. labor market remains resilient. The U.S. economy grew at a solid 2.9% annual rate last quarter but entered 2023 with less momentum. U.S. growth in the fourth quarter was down slightly from a 3.2% annual rate in the third quarter, according to the Commerce Department.8
Outlook
The positive inflation news is offset by the continuing risk of a mild recession, which economists expect could begin in the second quarter of this year. While recessions can lead to short-term market declines, the stock market historically has led the economy—not the other way around. We believe last year’s losses discounted much of the bad news we are experiencing now in the economy. Recessions historically have lasted about 10 months—much shorter than economic expansions. Investors with long-term goals, like saving for retirement, should stay the course and use any market pullbacks to buy quality investments at a lower price.
Footnotes:
1 Bloomberg. January 15, 2023.
2 FRED Economic Data. Market Yield on U.S. Treasury Securities at 10-Year Constant Maturity.
3 Wall Street Journal. January 20, 2023.
4 Tradeweb
5 Wall Street Journal. January 20, 2023.
6 Bloomberg Survey. January 2, 2023.
7 FRED Economic Data. 10-Year Treasury Constant Maturity Minus 2-Year Treasury Constant Maturity.
8 Wall Street Journal. January 26, 2023.
Disclosures:
This market commentary is meant for informational and educational purposes only and does not consider any individual personal considerations. As such, the information contained herein is not intended to be personal investment advice or recommendation. Please consult a financial professional before making any financial-related decisions.
The commentary represents an assessment of the market environment through January 2022. The views and opinions expressed may change based on the market or other conditions. The forward-looking statements are based on certain assumptions, but there can be no assurance that forward-looking statements will materialize. This commentary was written and provided by an unaffiliated third party.
Indexes are unmanaged and cannot be directly invested into. Past performance is no indication of future results. Investing involves risk and the potential to lose principal.
AdvicePeriod is another business name and brand utilized by both Mariner, LLC and Mariner Platform Solutions, LLC, each of which is an SEC registered investment adviser. Registration of an investment adviser does not imply a certain level of skill or training. Each firm is in compliance with the current notice filing requirements imposed upon SEC registered investment advisers by those states in which each firm maintains clients. Each firm may only transact business in those states in which it is notice filed or qualifies for an exemption or exclusion from notice filing requirements. Any subsequent, direct communication by an advisor with a prospective client shall be conducted by a representative that is either registered or qualifies for an exemption or exclusion from registration in the state where the prospective client resides. For additional information about Mariner, LLC or Mariner Platform Solutions, LLC, including fees and services, please contact us utilizing the contact information provided herein or refer to the Investment Adviser Public Disclosure website (www.adviserinfo.sec.gov). Please read the disclosure statement carefully before you invest or send money.
For additional information as to which entity your adviser is registered as an investment adviser representative, please refer to the Investment Adviser Public Disclosure website (www.adviserinfo.sec.gov) or the Form ADV 2B provided to you. Investment adviser representatives of Mariner, LLC dba Mariner Wealth Advisors and dba AdvicePeriod are generally employed by Mariner Wealth Advisors, LLC. Investment adviser representatives of Mariner Platform Solutions, LLC dba AdvicePeriod, are independent contractors.
Index Definitions: The S&P 500 is a capitalization-weighted index designed to measure performance of the broad domestic economy through changes in the aggregate market value of 500 stocks representing all major industries. Russell 2000 consists of the 2,000 smallest U.S. companies in the Russell 3000 index. MSCI EAFE is an equity index which captures large and mid-cap representation across Developed Markets countries around the world, excluding the U.S. and Canada. The index covers approximately 85% of the free float-adjusted market capitalization in each country. MSCI Emerging Markets captures large and mid-cap representation across Emerging Markets countries. The index covers approximately 85% of the free-float adjusted market capitalization in each country. Bloomberg U.S. Aggregate Index covers the U.S. investment grade fixed rate bond market, with index components for government and corporate securities, mortgage pass-through securities, and asset-backed securities. Bloomberg U.S. Corporate High Yield Index covers the universe of fixed rate, non-investment grade debt. Eurobonds and debt issues from countries designated as emerging markets (sovereign rating of Baa1/BBB+/BBB+ and below using the middle of Moody’s, S&P, and Fitch) are excluded, but Canadian and global bonds (SEC registered) of issuers in non-EMG countries are included. FTSE NAREIT Equity REITs Index contains all Equity REITs not designed as Timber REITs or Infrastructure REITs. Bloomberg Commodity Index is calculated on an excess return basis and reflects commodity futures price movements. The index rebalances annually weighted 2/3 by trading volume, and 1/3 by world production and weight-caps are applied at the commodity, sector, and group level for diversification.
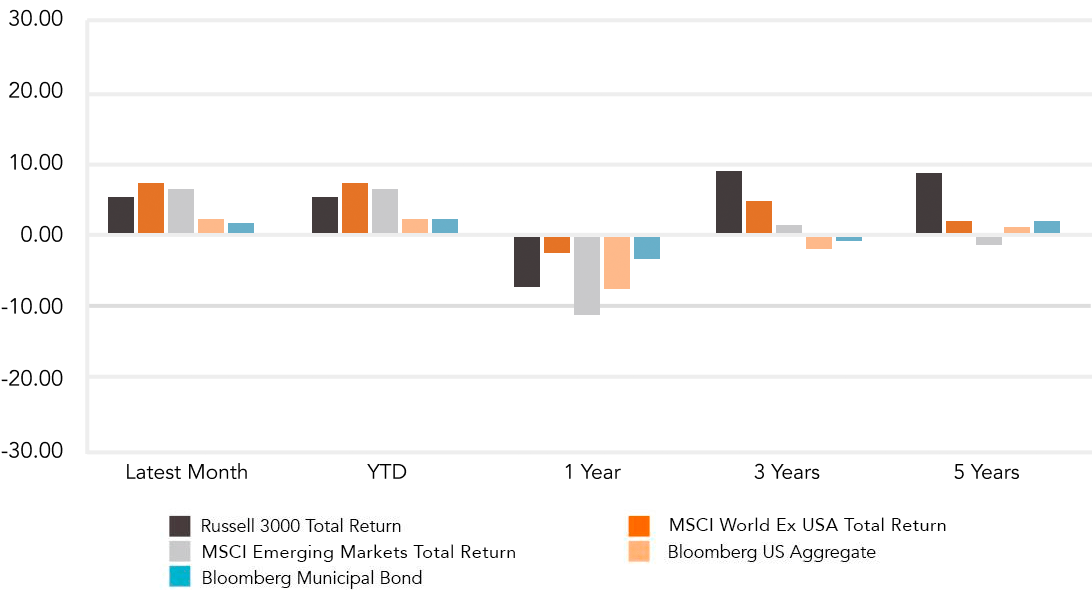
Does past performance matter?
Major Market Index Returns
Period Ending 2/1/2023
Multi-year returns are annualized.

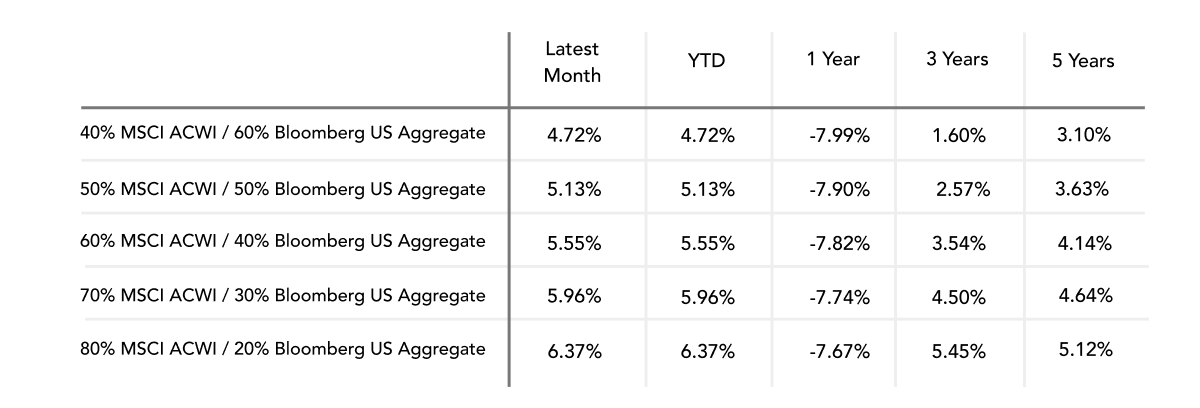
Mix Index Returns
Global Equity / US Taxable Bonds
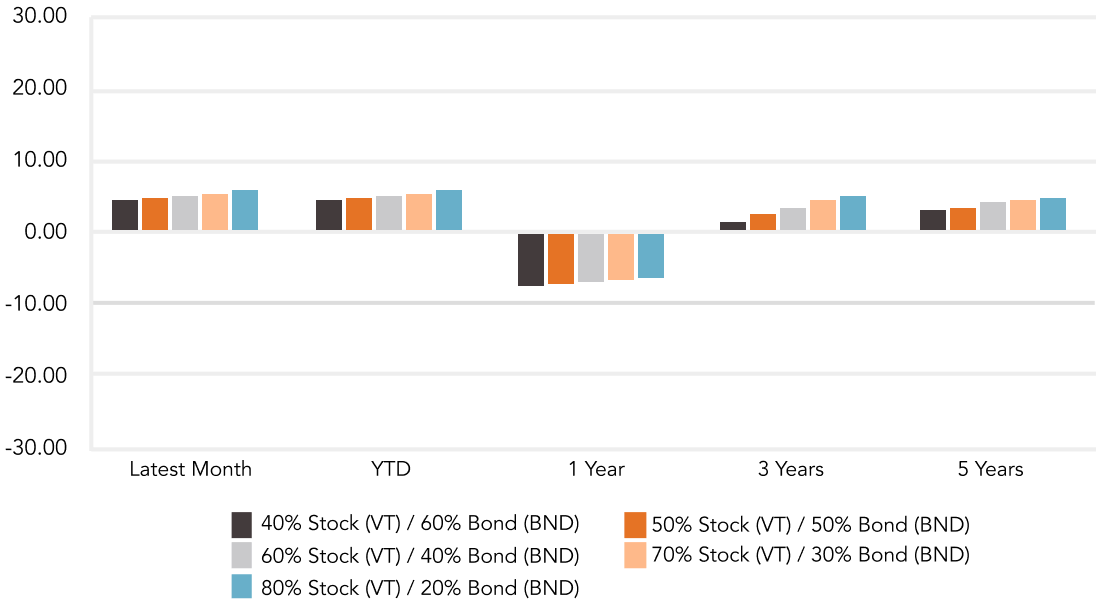
Indexes are unmanaged and cannot be directly invested into. Past performance is no indication of future results. Investing involves risk and the potential to lose principal.
The Russell 3000 Index is a United States market index that tracks the 3000 largest companies. MSCI Emerging Markets Index is a broad market cap-weighted Index showing the performance of equities across 23 emerging market countries defined as emerging markets by MSCI. MSCI ACWI ex-U.S. Index is a free-float adjusted market capitalization-weighted index that is designed to measure the equity market performance of developed and emerging markets excluding companies based in the United States. Bloomberg U.S. Aggregate Bond Index represents the investment-grade, U.S. dollar-denominated, fixed-rate taxable bond market, including Treasuries, government-related and corporate securities, as well as mortgage and asset-backed securities. Bloomberg Municipal Index is the US Municipal Index that covers the US dollar-denominated long-term tax-exempt bond market. The index has four main sectors: state and local general obligation bonds, revenue bonds, insured bonds, and prerefunded bonds.
April 2024 Market Commentary