Please find our most recent market review below. We hope these perspectives are valuable to you.
– The AdvicePeriod Team
Risk Assets Struggle Across the Board
Equity and fixed income markets moved lower in February as investors realized the Federal Reserve may remain hawkish in the months ahead.
Key Observations
- The stock market gave back some of its year-to-date gains in February as risk assets were down across the board.
- Bonds ended the month lower as yields rose.
- International markets posted a modest decline, with emerging markets underperforming the U.S., but international developed markets slightly outperforming the U.S. equity market.
- The U.S. yield curve remains inverted, which has been a leading indicator of recession historically, with the 2-10 year inversion reaching levels not seen in four decades.1
Market Recap
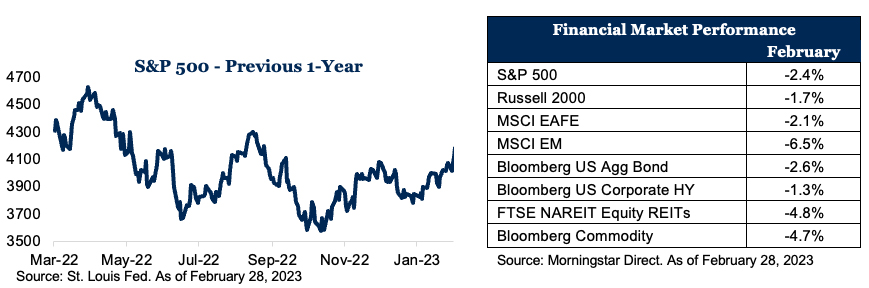
The post-pandemic theme of the major asset classes moving in unison continued in February as they all gave back some of their January gains. This was driven by strong U.S. economic data, leading investors to believe the Fed will remain hawkish for longer. Per Bloomberg, “The Derivatives market is pricing U.S. rates to top at 5.4% this year, compared with about 5% just a month ago.”2 With investors expecting rates to remain higher for longer, the equity markets were hurt, with the S&P 500 down 2.4% for the month. Small-cap stocks, as measured by the Russell 2000 Index, outperformed their larger counterparts, only dropping 1.7% in February; small caps now are outperforming large caps by over 4% year to date. Non-U.S. equities were also down in February, with emerging markets hit the hardest, dropping 6.5%. China was a headwind to emerging markets, as it was down over 10%,3 hurt by a weaker yuan and headline risk with the Chinese spy balloon controversy, reports that China likely will send weapons to Russia, and concerns over their distressed housing market.
Fixed income markets also struggled for the month, with yields rising, and the 10-year yield reaching levels not seen since November.>4/sup> Short-term rates also rose, with two-year Treasury yields reaching their highest levels since 2007.5 As a result, the Bloomberg U.S. Aggregate Bond Index was down 2.6% for the month. U.S. corporate high yield outperformed the Aggregate Bond Index by 1.3%. Other areas of the market, such as REITs, underperformed the broader market but are outperforming the S&P 500 by over 1.5% year to date. Commodities also struggled as oil prices continued to fall.
Global Economy Stabilizing
On balance, the outlook for the global economy has improved in recent weeks. Notably, the outlook for the eurozone has picked up. The S&P Global Flash U.S. Composite PMI climbed 3.4 points in February into expansion territory, its best level since June 2022. The improvement comes on the back of better-than-expected U.S. economic data for January, including nonfarm payrolls and retail sales. Nonfarm payrolls rose a stunning 517,000 in January, nearly triple expectations of 187,000, while the unemployment rate ticked down to 3.4%, the lowest since May 1969. The ISM Services PMI rebounded by 6.0 points in January to 55.2, the biggest increase since June 2020 and the second-largest jump on record. New orders surged 15.2 points, the second-highest increase ever, to 60.4 as demand rebounded. Offsetting economic strength in the U.S. was weaker home sales. Existing home sales dropped 0.7% in January to a 4-million-unit annual rate, the lowest level since October 2010 and the 12th consecutive decline in sales. The Conference Board’s Leading Economic Index (LEI) fell 0.3% in January, down for the 10th consecutive month. It was led by a continued deterioration in factory new orders, consumer expectations of business conditions and credit conditions. Persistent labor market strength and stock market gains provided a partial offset.
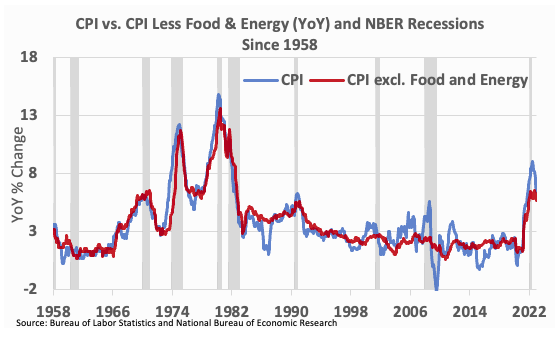
In several February appearances, Fed Chair Powell repeated that the disinflation process has begun. CPI inflation peaked at 9.1% last June and has come down to 6.4% in January. Following the January CPI and PPI reports and strong retail sales, markets are repricing and pushing off expected rate cuts into 2024. While goods inflation has come down significantly, services inflation has not. Even services inflation, excluding energy and housing, Powell’s preferred measure of underlying price pressures, has moved only slightly to 6.1% year over year in January from a peak of 6.7% year over year last September. Alternative measures of core inflation are also still at or near historic highs. Persistent strength in wage growth has continued to put upward pressure on unit labor costs and inflation. All of this suggests that the Fed’s 2% inflation target may take longer than expected to achieve. The consensus view is that the Fed will need to hike two more times this year then pause to evaluate the cumulative impact of tighter policy.
Outlook
While the risk of recession in the U.S. is still present, a soft landing is not off the table given a strong labor market and easing inflation trends. History suggests that the past year’s tight monetary policy will continue to negatively impact the global economy, at least for the next six months.
Footnotes:
1 FRED Economic Data
2 Bloomberg. February 28, 2023
3 Measured by MSCI China NR USD index
4 FRED Economic Data
5 FRED Economic Data
Disclosures:
This market commentary is meant for informational and educational purposes only and does not consider any individual personal considerations. As such, the information contained herein is not intended to be personal investment advice or recommendation. Please consult a financial professional before making any financial-related decisions.
The commentary represents an assessment of the market environment through February 2023. The views and opinions expressed may change based on the market or other conditions. The forward-looking statements are based on certain assumptions, but there can be no assurance that forward-looking statements will materialize. This commentary was written and provided by an unaffiliated third party.
Indexes are unmanaged and cannot be directly invested into. Past performance is no indication of future results. Investing involves risk and the potential to lose principal.
AdvicePeriod is another business name and brand utilized by both Mariner, LLC and Mariner Platform Solutions, LLC, each of which is an SEC registered investment adviser. Registration of an investment adviser does not imply a certain level of skill or training. Each firm is in compliance with the current notice filing requirements imposed upon SEC registered investment advisers by those states in which each firm maintains clients. Each firm may only transact business in those states in which it is notice filed or qualifies for an exemption or exclusion from notice filing requirements. Any subsequent, direct communication by an advisor with a prospective client shall be conducted by a representative that is either registered or qualifies for an exemption or exclusion from registration in the state where the prospective client resides. For additional information about Mariner, LLC or Mariner Platform Solutions, LLC, including fees and services, please contact us utilizing the contact information provided herein or refer to the Investment Adviser Public Disclosure website (www.adviserinfo.sec.gov). Please read the disclosure statement carefully before you invest or send money.
For additional information as to which entity your adviser is registered as an investment adviser representative, please refer to the Investment Adviser Public Disclosure website (www.adviserinfo.sec.gov) or the Form ADV 2B provided to you. Investment adviser representatives of Mariner, LLC dba Mariner Wealth Advisors and dba AdvicePeriod are generally employed by Mariner Wealth Advisors, LLC. Investment adviser representatives of Mariner Platform Solutions, LLC dba AdvicePeriod, are independent contractors.
Index Definitions: The S&P 500 is a capitalization-weighted index designed to measure the performance of the broad domestic economy through changes in the aggregate market value of 500 stocks representing all major industries. Russell 2000 consists of the 2,000 smallest U.S. companies in the Russell 3000 index. MSCI EAFE is an equity index which captures large and mid-cap representation across Developed Markets countries around the world, excluding the U.S. and Canada. The index covers approximately 85% of the free float-adjusted market capitalization in each country. MSCI Emerging Markets captures large and mid-cap representation across Emerging Markets countries. The index covers approximately 85% of the free-float adjusted market capitalization in each country. Bloomberg U.S. Aggregate Index covers the U.S. investment grade fixed rate bond market, with index components for government and corporate securities, mortgage pass-through securities, and asset-backed securities. Bloomberg U.S. Corporate High Yield Index covers the universe of fixed rate, non-investment grade debt. Eurobonds and debt issues from countries designated as emerging markets (sovereign rating of Baa1/BBB+/BBB+ and below using the middle of Moody’s, S&P, and Fitch) are excluded, but Canadian and global bonds (SEC registered) of issuers in non-EMG countries are included. FTSE NAREIT Equity REITs Index contains all Equity REITs not designed as Timber REITs or Infrastructure REITs. Bloomberg Commodity Index is calculated on an excess return basis and reflects commodity futures price movements. The index rebalances annually weighted 2/3 by trading volume, and 1/3 by world production and weight-caps are applied at the commodity, sector, and group level for diversification.
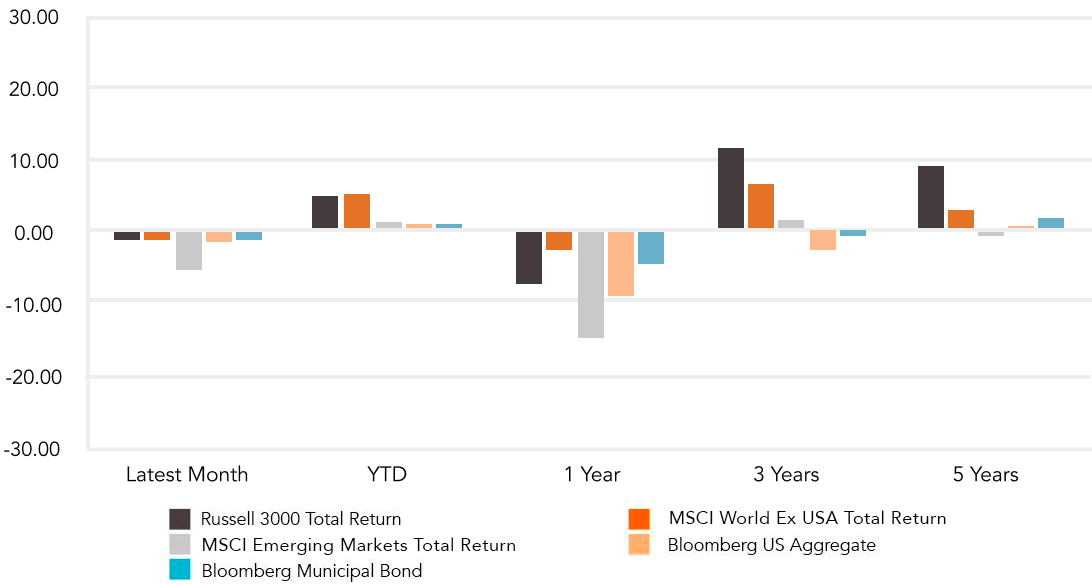
Does past performance matter?
Major Market Index Returns
Period Ending 3/1/2023
Multi-year returns are annualized.

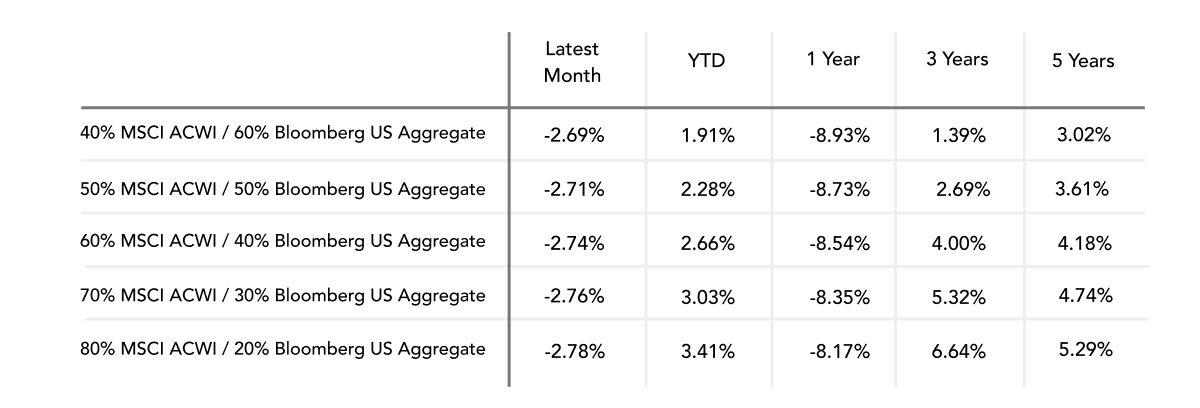
Mix Index Returns
Global Equity / US Taxable Bonds
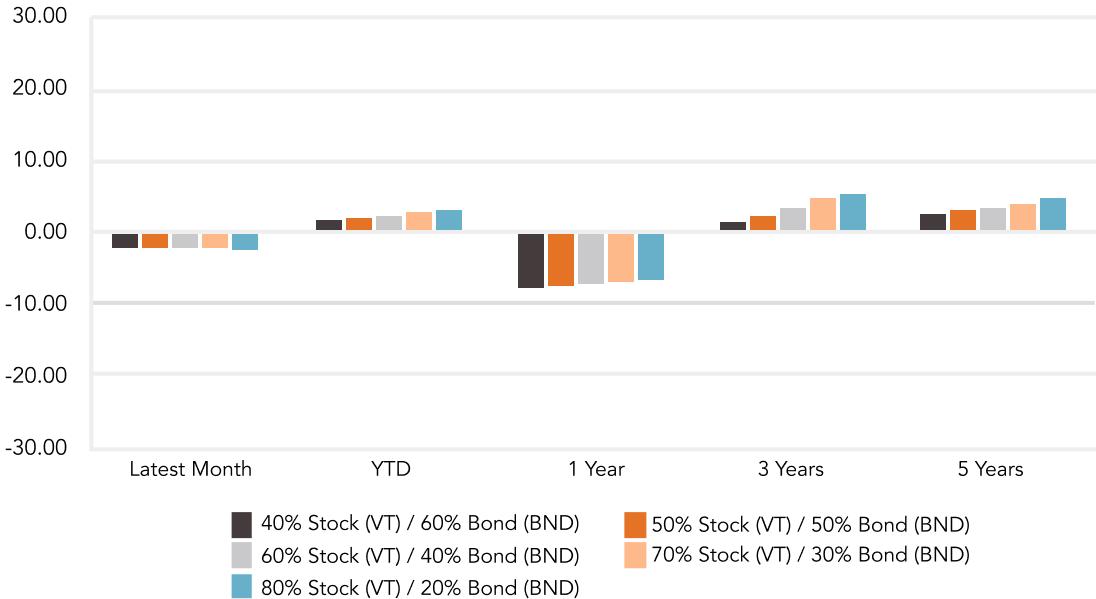
Indexes are unmanaged and cannot be directly invested into. Past performance is no indication of future results. Investing involves risk and the potential to lose principal.
The Russell 3000 Index is a United States market index that tracks the 3000 largest companies. MSCI Emerging Markets Index is a broad market cap-weighted Index showing the performance of equities across 23 emerging market countries defined as emerging markets by MSCI. MSCI ACWI ex-U.S. Index is a free-float adjusted market capitalization-weighted index that is designed to measure the equity market performance of developed and emerging markets excluding companies based in the United States. Bloomberg U.S. Aggregate Bond Index represents the investment-grade, U.S. dollar-denominated, fixed-rate taxable bond market, including Treasuries, government-related and corporate securities, as well as mortgage and asset-backed securities. Bloomberg Municipal Index is the US Municipal Index that covers the US dollar-denominated long-term tax-exempt bond market. The index has four main sectors: state and local general obligation bonds, revenue bonds, insured bonds, and prerefunded bonds.

April 2024 Market Commentary